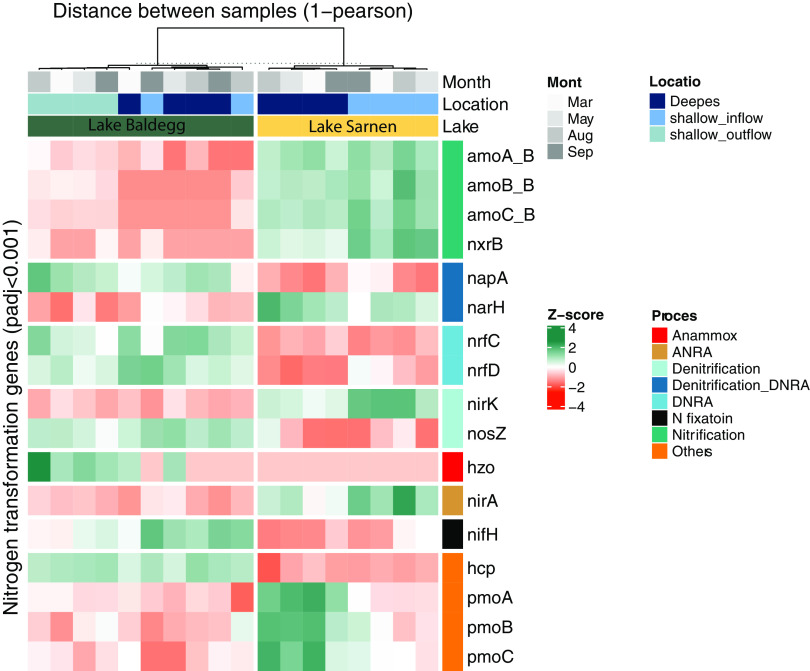
FIG 6.
Heatmap of nitrogen gene abundances showing significant differences between Lake Baldegg (green) and Lake Sarnen (yellow) (alpha = 0.001; padj, adjusted P value with Benjamini-Hochberg method from DESeq2) clustered by lake and station (column clustering distance calculated using Pearson from the ComplexHeatmap package) in the columns and nitrogen process in the rows. The z-score of abundances was calculated for each gene individually to emphasize the differences.

