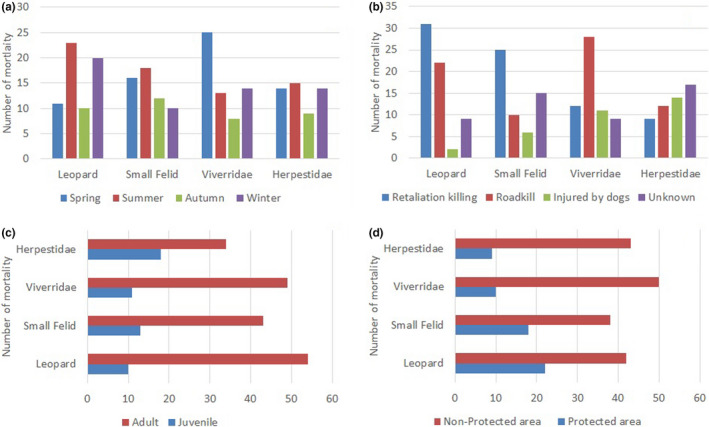
FIGURE 2.

Bar graphs representing (a) number of mortality of four groups of carnivores according to seasons. (b) Number of mortality of four groups of carnivores according to cause. (c) Number of mortality of four groups of carnivores according to age category. (d) Number of mortality of four groups of carnivores according to protected area status
