FIGURE 5.

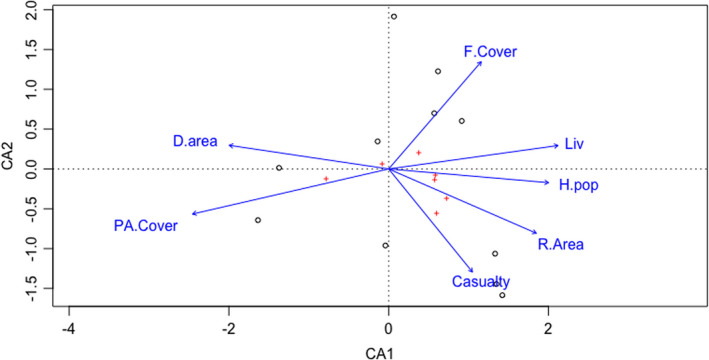
CAA ordination biplot representing the association between district wise variables (protected area cover, district area, forest cover area, number of livestock, human population, risk area km2, and number of casualty) within 11 districts

CAA ordination biplot representing the association between district wise variables (protected area cover, district area, forest cover area, number of livestock, human population, risk area km2, and number of casualty) within 11 districts