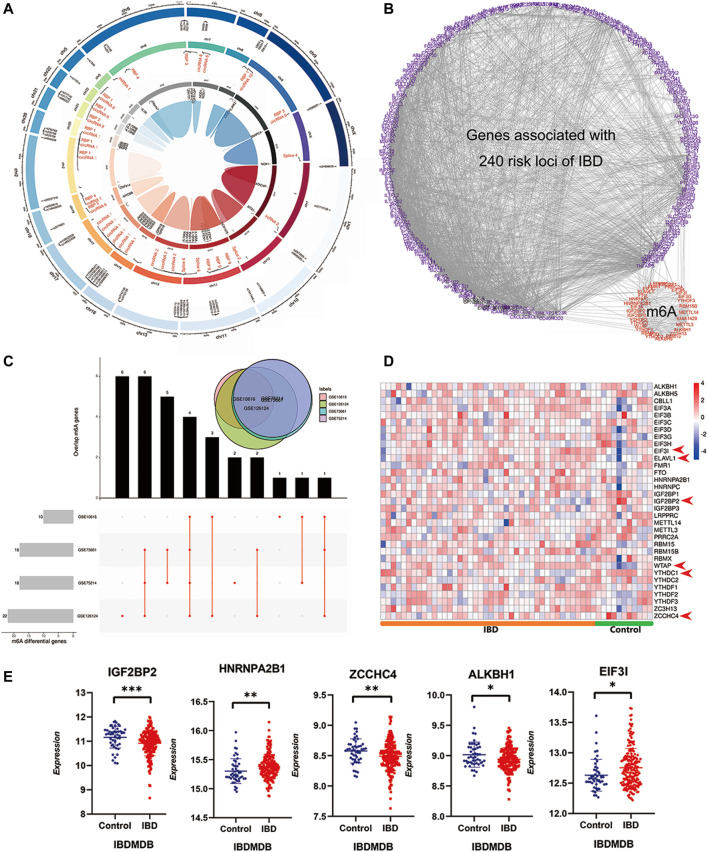
FIGURE 2.
A widespread interaction and participation of m6A modifications in IBD. (A) is the Circos diagram of known m6A modifications in IBD associated risk SNPs based m6A sequencing. The outer circle indicates the positions of m6A modified IBD associated risk SNPs in chromosome, the middle circle is transcriptome regulation of risk SNPs, the inner circle is the risk gene name. (B) is the interaction network of 240 known IBD risk genes and m6A reader, writer and eraser genes. (C) is the UpSet diagram of differential m6A regulators in four independent discovery IBD cohorts. The upper right venn displays the overlaps of differential genes in four cohorts together. (D) is the heatmap of m6A reader, writer and eraser in validatory IBDMDB cohort. (E) is the expressing profile of top differential m6A regulators in the validatory IBDMDB cohort (t test, p < 0.05).

