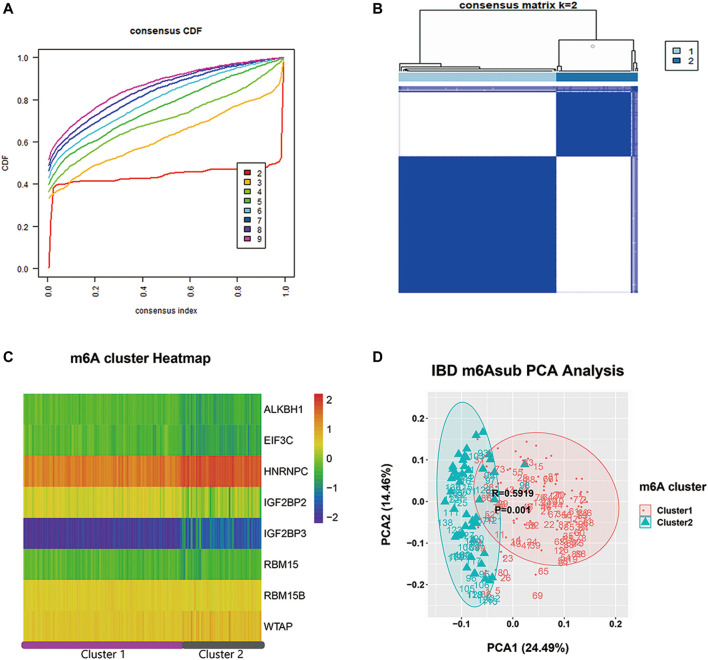
FIGURE 3.
The consensus clustering analysis of m6A regulators in IBDMDB cohort. (A) is the consensus CDF diagram which show a good clustering is obtained when k = 2. (B) is the different clusters after consensus clustering by k = 2, (C) is the heatmap of m6A reader, writer and eraser expression in different clusters. (D) is the PCA analysis that shows well discrimination between two clusters.

