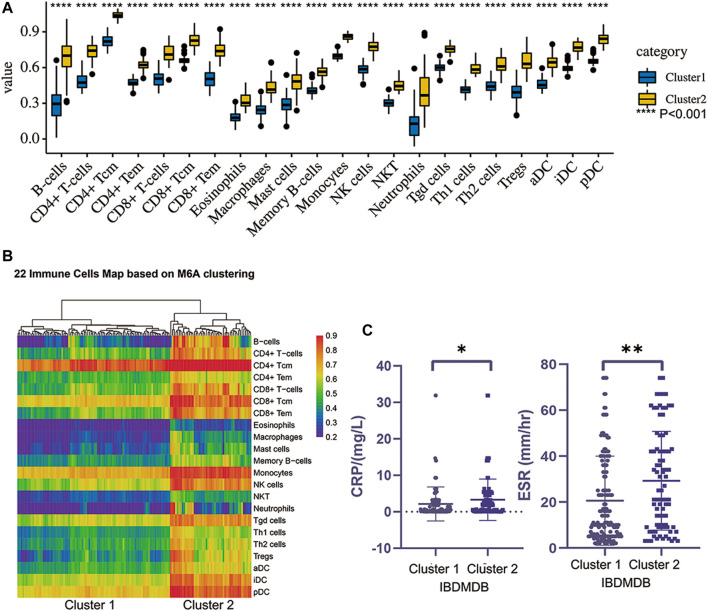
FIGURE 4.
The different immune landscape and clinical phenotypes of two clusters obtained by consensus clustering. (A) is the different immune scoring of major 22 immune cells in two clusters (p < 0.01). (B) is the heatmap of the two clusters’ immune landscape. (C) is the difference of two clusters clinical indexes such as ESR and CRP (t test, p < 0.05).

