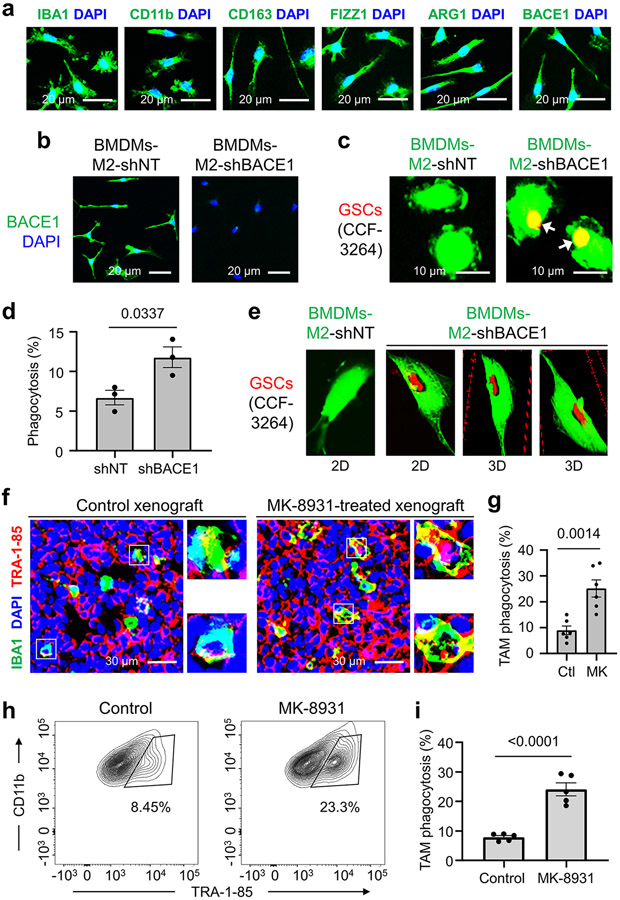
Extended Data Fig. 2. BACE1 Inhibition Promotes Macrophage Phagocytosis of Glioma Cells in vitro and in vivo.
a, Immunofluorescent analyses of pan TAM markers (IBA1 or CD11b), M2 macrophage makers (CD163, ARG1, or FIZZ1), and BACE1 expression in bone marrow-derived M2-like macrophages (BMDMs-M2). Representative images show expression of BACE1 and M2 macrophage markers in BMDMs-M2 macrophages.
b, Immunofluorescent analysis of BACE1 expression in BMDMs-M2 macrophages transduced with shBACE1 or shNT (control).
c,d, Representative fluorescent images (c) show phagocytosis of BMDMs (in green) against GSCs (CCF-3264, in red) after BACE1 disruption in BMDMs. Quantification (d) shows fractions of BMDMs containing engulfed glioma cells. Data are shown as means ± SEM. n = 3 independent experiments (about 300 BMDMs/group/experiment). Statistical significance was determined by two-tailed Student’s t-test; p=0.0337.
e, In vitro analyses of macrophage phagocytosis of glioma cells by confocal microscopy and Z-stack reconstruction to confirm the engulfment of GSCs (in red) by BMDMs (in green) after BACE1 disruption. Representative 2D and 3D images are shown.
f,g, Representative images (f) and quantification (g) show MK-8931-activated TAM (IBA1+, in green) phagocytosis of glioma cells (TRA-1-85+, in red) in GBM xenografts derived from CCF-DI315 GSCs. Data are shown as means ± SEM. n = 6 tumor samples (each sample includes about 80 TAMs). Statistical significance was determined by two-tailed Student’s t-test; p=0.0014. Ctl: Control; MK: MK-8931.
h,i, Representative flow cytometric plots (h) show gating strategy for identifying TAM (CD45+/Gr1−/CD11b+/DAPI−) phagocytosis of tumor cells (TRA-1-85+) from GBM xenografts treated with MK-8931 or vehicle control. Quantifications (i) of TAM phagocytosis show fractions of macrophage phagocytosis of glioma cells (CD11b+/TRA-1-85+) in the treated and control xenografts. Data are shown as means ± SEM. n = 5 tumor samples per group. Statistical significance was determined by two-tailed Student’s t-test; p<0.0001.

