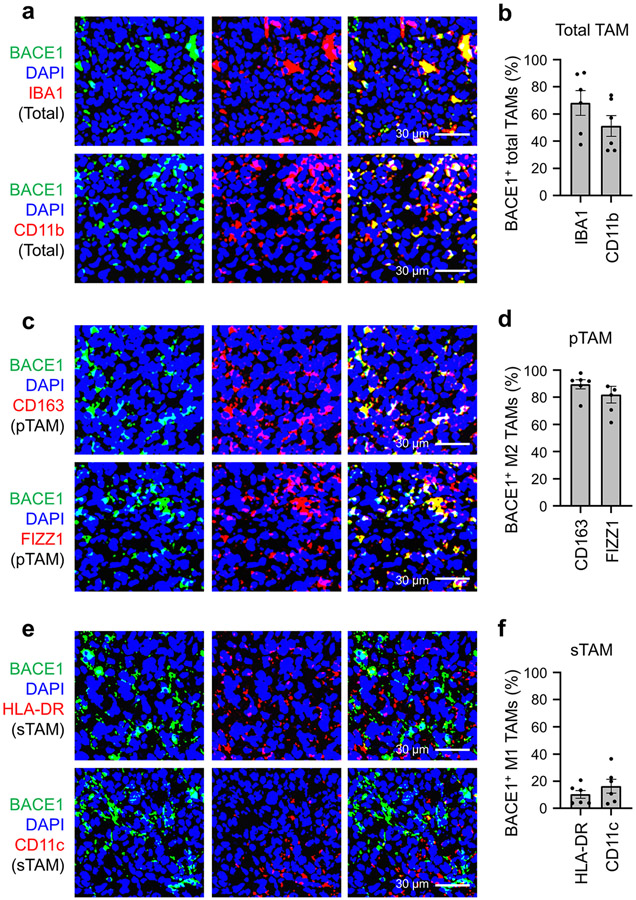
Extended Data Fig. 3. BACE1 Is Highly Expressed by pTAMs in GBM Xenografts.
a,b, Immunofluorescent analyses of BACE1 and the pan TAM marker IBA1 or CD11b in GBM xenografts derived from GSCs (CCF-3264 or CCF-DI315). Representative immunofluorescent images (a) show the distribution and co-localization of BACE1 (in green) with the pan TAM marker (IBA1 or CD11b; in red) in GBM xenografts. Quantifications (b) show the fractions of BACE1-positive TAMs (BACE1+/IBA1+ or BACE1+/CD11b+ cells) in total TAMs (IBA1+ or CD11b+ cells) in GBM xenografts. Data are shown as means ± SEM. n = 6 GBM xenografts per group.
c,d, Immunofluorescent analyses of BACE1 and the pTAM marker CD163 or FIZZ1 in GBM xenografts derived from GSCs (CCF-3264 or CCF-DI315). Representative immunofluorescent images (c) show the distribution and co-localization of BACE1 (in green) with pTAM markers (CD163 and FIZZ1; in red) in GBM xenografts. Quantification (d) shows the fractions of BACE1-positive pTAMs (BACE1+/CD163+ or BACE1+/FIZZ1+ cells) in total pTAMs (CD163+ or FIZZ1+ cells) in GBM xenografts. Data are shown as means ± SEM. n = 6 GBM xenografts per group.
e,f, Immunofluorescent analyses of BACE1 and the sTAM marker HLA-DR or CD11c in GBM xenografts derived from GSCs (CCF-3264 or CCF-DI315). Representative immunofluorescent images (e) show staining of BACE1 (in green) and the sTAM markers (HLA-DR or CD11c; in red) in GBM xenografts. Quantification (f) shows the fractions of BACE1+ sTAMs (BACE1+HLA-DR+ or BACE1+CD11c+ cells) in total sTAMs (HLA-DR+ or CD11c+ cells) in GBM xenografts. Data are shown as means ± SEM. n = 6 GBM xenografts per group.

