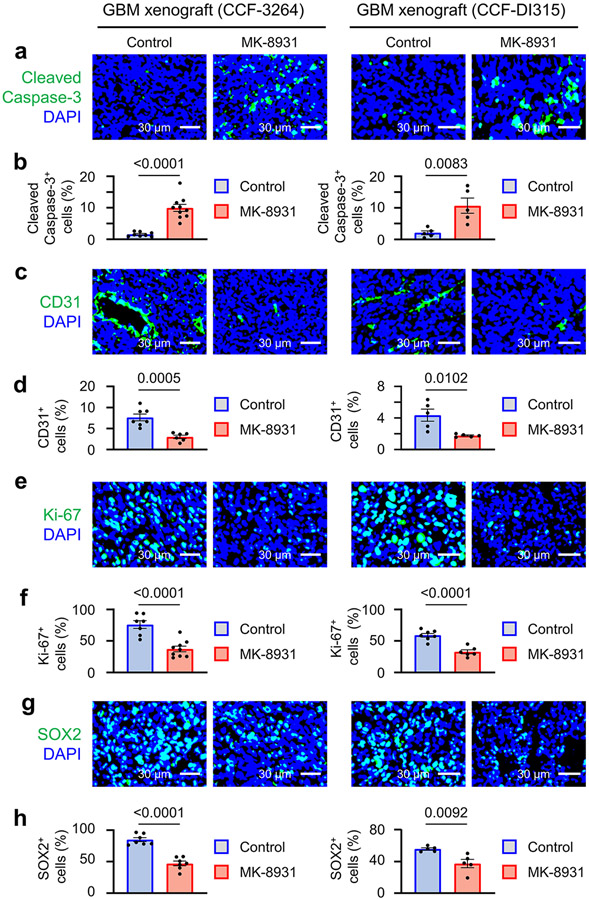
Extended Data Fig. 4. The Effects of MK-8931 Treatment on Apoptosis, Proliferation, Vessel density and GSC population in GBM Xenografts.
a,b, Representative immunofluorescent images (a) of cleaved caspase-3 staining to detect apoptosis in MK-8931-treated or control GBM xenografts derived from GSCs (CCF-3264 or CCF-DI315). Quantifications (b) show fractions of cleaved caspase-3+ cells in the MK-8931-treated or control tumors. CCF-3264 xenografts: n = 10 (MK-8931-treated) or 8 (control) tumors; CCF-DI315 xenografts: n = 5 tumors per group.
c,d, Representative immunofluorescent images (c) of CD31 staining to examine vessel density in MK-8931-treated or control GBM xenografts derived from GSCs (CCF-3264 or CCF-DI315). Quantifications (d) show relative vessel density (CD31+ cells) in the MK-8931-treated or control tumors. CCF-3264 xenografts: n = 6 (MK-8931-treated) or 7 (control) tumors; CCF-DI315 xenografts: n = 5 tumors per group.
e,f, Representative immunofluorescent images (e) of Ki-67 staining to detect cell proliferation in MK-8931-treated or control GBM xenografts derived from GSCs (CCF-3264 or CCF-DI315). Quantifications (f) show that fractions of proliferative cells (Ki-67+) in the MK-8931-treated or control tumors. CCF-3264 xenografts: n = 10 (MK-8931-treated) or 8 (control) tumors; CCF-DI315 xenografts: n = 5 tumors per group.
g,h, Representative immunofluorescent images (g) of SOX2 staining to detect GSC populations in MK-8931-treated or control GBM xenografts derived from GSCs (CCF-3264 or CCF-DI315). Quantifications (h) show the fractions of GSCs (SOX2+ cells) in the MK-8931-treated or control tumors. CCF-3264 xenografts: n = 6 (MK-8931-treated) or 7 (control) tumors; CCF-DI315 xenografts: n = 5 tumors per group.
Data are shown as means ± SEM; statistical significance was determined by two-tailed Student’s t-test; p values are indicated on the figures (b,d,f,h).

