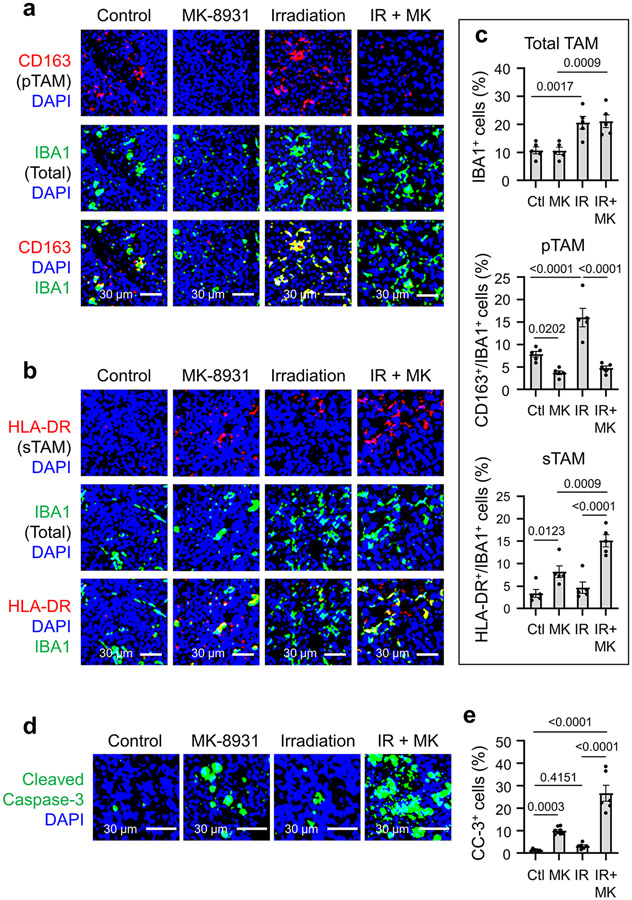
Extended Data Fig. 9. The Effect of the Combined Low Doses of Irradiation and MK-8931 Treatment on TAM Polarization in GBM Xenografts.
a-c, Analyses of relative density of pTAMs (a) or sTAMs (b) by double immunofluorescent staining of the pan TAM marker IBA1 (in green) and the pTAM marker CD163 (in red) or the sTAM marker HLA-DR (in red) in CCF3264 GSC-derived GBM xenografts treated with MK-8931, Irradiation (IR, 2×2 Gy), IR plus MK-8931, or a vehicle control. Representative images show immunofluorescent staining of IBA1 and the pTAM marker CD163 (a) or IBA1 and the sTAM marker HLA-DR (b) in GBM xenografts from the four groups. Quantifications (c) show fractions of total TAMs (IBA1+ cells), pTAMs (IBA1+/CD163+ cells) and sTAMs (IBA1+/HLA-DR+ cells) in GBM xenografts from the four groups. Data are shown as means ± SEM. n = 5 GBM tumors per group. Statistical significance was determined by one-way ANOVA analysis; p values are indicated on the figure.
d,e, In vivo analysis of cell apoptosis by immunofluorescent staining of cleaved caspase-3 in CCF3264 GSC-derived GBM xenografts treated with MK-8931, IR (2×2 Gy), IR plus MK-8931, or a vehicle control. Representative images (d) show immunofluorescent staining of cleaved caspase-3 in GBM xenografts from the four groups. Quantifications (e) show the fractions of cleaved caspase-3+ (CC-3+) cells in GBM xenografts from the four groups. Data are shown as means ± SEM. n = 6-8 GBM tumors per group. Statistical significance was determined by one-way ANOVA analysis; p values are indicated on the figure.
Ctl: Control; MK: MK-8931; IR: Irradiation.

