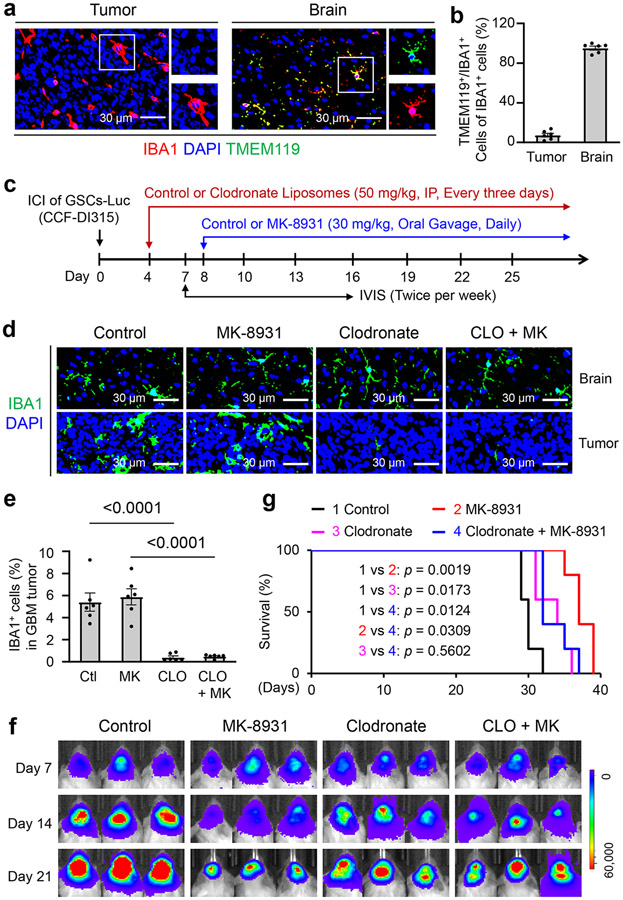
Fig. 5: Depletion of Monocyte-derived TAMs by Clodronate Attenuates the Anti-tumor Effects of MK-8931 Treatment in GBM Xenografts.
a,b, Immunofluorescent staining of the microglia marker TMEM119 (in green) and the total TAM marker IBA1 (in red) to detect microglia distribution in GBM xenografts derived from CCF-DI315 GSCs and the adjacent normal brain. Representative immunofluorescent images (a) are shown. Quantifications (b) show the relative fractions of IBA1+/TMEM119+ cells (microglia) in GBM tumors and the adjacent normal brain. Data are shown as means ± SEM. n = 6 tumor samples per group.
c, A schematic illustration showing treatment with clodronate (for depletion of monocyte-derived TAMs) or/and MK-8931 in GBM xenografts derived from CCF-DI315 GSCs. ICI: Intracranial injection; IP: Intraperitoneal injection; IVIS: In Vivo Imaging Systems. Luc: Luciferase.
d, e, Immunofluorescent staining of IBA1 in GBM xenografts derived from CCF-DI315 GSCs and the adjacent normal brain from mice treated with MK-8931 (MK), Clodronate (CLO), MK plus CLO, or the vehicle control. Representative immunofluorescent images (d) of IBA1 staining (in green) are shown. Quantifications (e) show fractions of TAMs (IBA1+ cells) in GBM xenografts with indicated treatment. Data are shown as means ± SEM. n = 6 tumor samples per group. Statistical significance was determined by one-way ANOVA analysis; Ctl vs CLO: p<0.0001; MK vs CLO + MK: p<0.0001.
f, In vivo bioluminescent analysis to monitor intracranial tumor growth of GBM xenografts derived from CCF-DI315 GSCs in mice treated with MK-8931 (MK), Clodronate (CLO), MK plus CLO, or vehicle control. Representative bioluminescent images on the indicated days were shown.
g, Kaplan-Meier survival curves of mice bearing the GSC-derived GBM xenografts treated with MK-8931 (MK), Clodronate (CLO), MK plus CLO, or the vehicle control. n = 5 mice per group. Log-rank analysis was used to assess the significance; p values are indicated on the figure.

