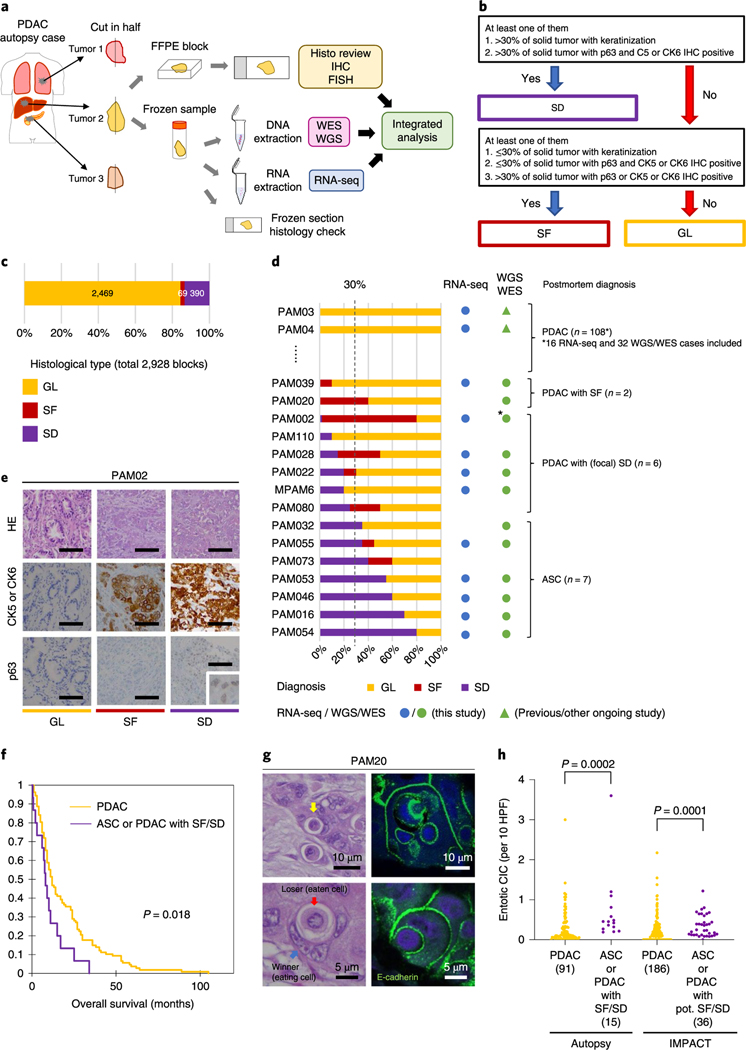
Fig. 1 |. Study overview and morphologic heterogeneity for squamous features in PDAC.
a, Study overview of integrated analysis in PDAC using multiregional sampling, b, Schematic for classification of sections. SD or SF was determined for each block in all cases based on the combination of histomorphological features and p63 and CK5/6 IHC. c, Summary of block diagnoses, d, Postmortem case diagnoses based on combination of the number of blocks with SF or SD of all blocks analyzed per patient and the percent of SF or SD within each positive block. PAM02 was reanalyzed for this study using previous data. e, Representative histomorphological and immunohistochemical images (167 IHC images taken from a total of 31 cases) of GL, SF and SD. (Images shown are in patient PAM02). SD areas showed a solid growth pattern with both CK5/6 and p63 positivity, whereas SF areas showed CK5/6-positive labeling but were negative for p63. f, Kaplan-Meier analysis of normal PDAC or PDAC with SF/SD or ASC. PDAC with SF/SD or ASC (n=15) showed poorer prognosis than PDACs without SF/SD (n = 106; P=0.018, log-rank test), g, Representative histomorphological and immunofluorescence (IF) images of entotic CICs in patient PAM20 (IF performed on 18 slides from ten cases). A clearly defined ‘moonshape’ host nucleus, intervening vacuolar space and internalized cell is identified. IF images clear e-cadherin membranous labeling of the winners (eating cells) and losers (eaten cells), h, Average number of entotic CICs in ASCs or PDACs with potential (pot.) SF/SD versus conventional GL patterns in autopsy (P=0.0002, two-sided Mann-Whitney U-test) and MSK Clinical IMPACT cohorts (P= 0.0001, two-sided Mann-Whitney U-test) respectively. Each sample number is shown in the figure.

