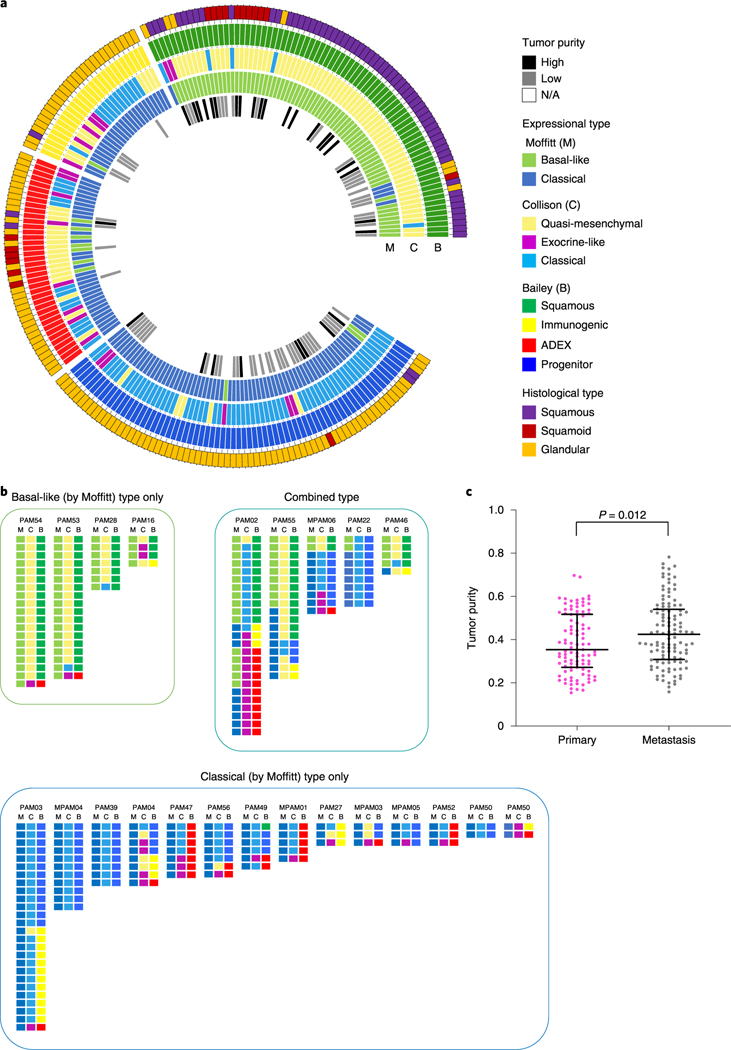
Fig. 3 |. Expressional profiles based on three major classification schemes in end-stage PDAC.
a, Circos plot of histological types, tumor purity and expressional subtypes based on the Moffitt, Collisson and Bailey gene sets, b, Expression subtypes within each individual patient reveals intratumoral heterogeneity, c, Tumor purity in primary and metastatic PDACs. Tumor purity obtained using the FACETS tool in end-stage PDAC shows that metastatic samples (n=116) have higher tumor purity than primary samples (n = 99; P = 0.012, two-sided Mann-Whitney U-test). Lines and bars represent median with interquartile range.

