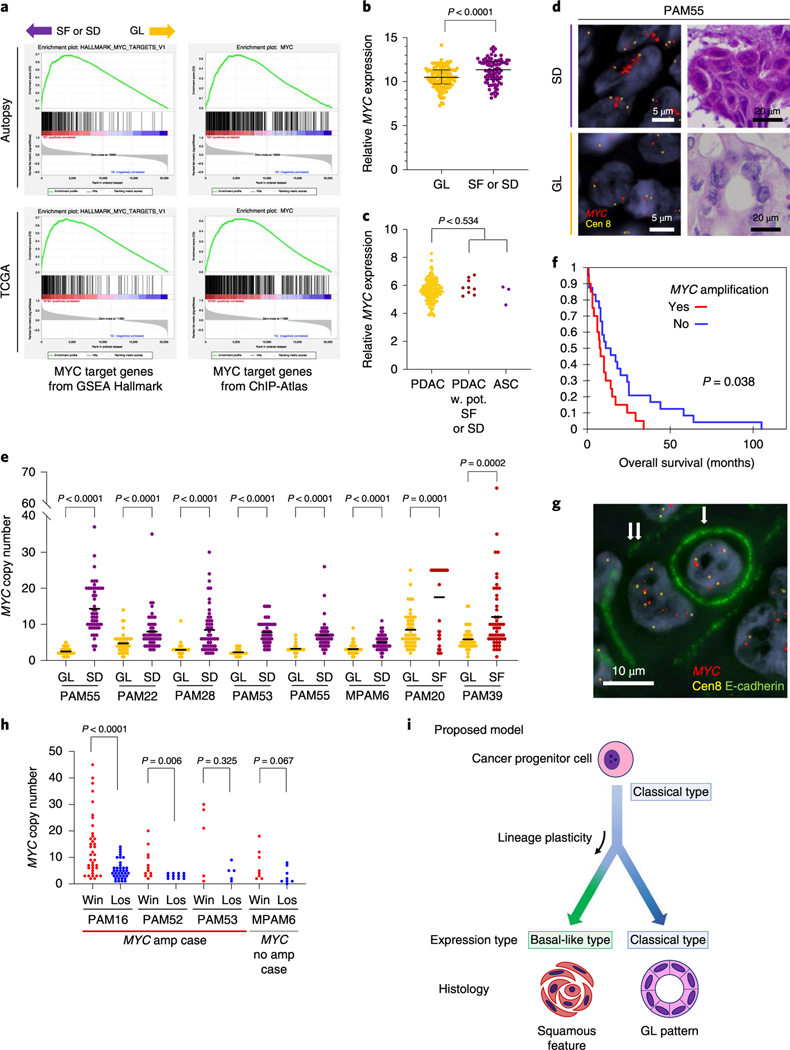
Fig. 8 |. Squamous features in pancreatic ductal adenocarcinoma correspond to enhancement of MYC.
a, GSEA using Hallmark gene sets and transcription factor target gene sets collected from the ChlP-Atlas identify MYC target genes as the significantly enriched gene set in SF or SD (see also Supplementary Tables 5–8). b, Normalized MYC mRNA expression in the autopsy cohort. Transcript abundance is significantly higher in SF or SD samples (n=81) than in GL samples (n=133) in the end-stage autopsy cohort (P< 0.0001, two-sided Mann-Whitney U-test), Lines and bars indicate the median and interquartile range, c, MYC mRNA expression in the TCGA cohort. No significant expressional difference was found between PDAC (n=133) and PDAC with potential SF or SD (n = 9) or ASC (n = 3; P= 0.534, two-sided Mann-Whitney U-test). d, Representative images of MYC FISH in SF or SD and GL regions (total 46 FISH-processed images), e, Analysis of MYC copy number in eight cases indicates that MYC is significantly amplified in SF or SD regions compared to GL regions in the same carcinoma. Each P value was calculated with a two-sided Mann-Whitney U-test. For each region, 50 cells were randomly picked up for MYC copy number count. Bars indicate the median, f, Kaplan-Meier analysis, indicating patients whose carcinomas have an MYC high (≥6) copy number (n = 20) have a worse outcome than carcinomas with a low MYC copy number (n = 24; P= 0.038, log-rank test), g, Representative images of entosis (single arrow indicates a loser (eaten cell), double arrows indicate a winner (eating cell); total 38 immuno-FISH-processed images), h, Winner (win) cells have a higher MYC copy number than loser (los) cells. P values were calculated using a two-sided Mann-Whitney U-test. Overall, 38,12,5 and 8 entotic CIC patterns were evaluated for PAM16, PAM52, PAM53 and MPAM6, respectively, i, Proposed model for the relationship of squamous feature and basal-like expression in PDAC. In this model, the development of squamous feature (SF or SD) is an adaptive process that results from a combination of genetic alterations, epigenetic plasticity and microenvironmental changes over the lifetime of the neoplasm.

