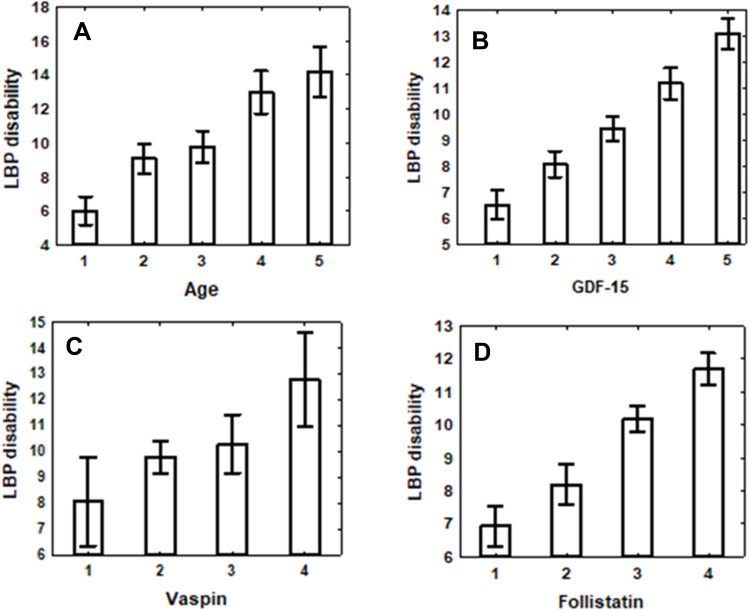
Figure 1.
Plots of LBP disability scores (mean ± SE) changes by soluble factor levels. (A) Age categories 1 through 5 correspond to values falling in the following ranges in years: [18≥ and <30), [30≥ and <40), [40≥ and <50), [50≥ and <60) [≥60 years). Ptrend =0.000001. (B) GDF-15 level categories 1 through 5 correspond to values falling in the following ranges in pg/mL: (<1.70 levels), [1.70≥ and <1.75), [1.75≥ and <1.80), [1.80≥ and <1.85), [≥1.85 levels). Ptrend before adjustment for age and sex p=1.22×10⁻¹⁵, after adjustment P=0.002. (C) Vaspin level categories 1 through 4 correspond to values falling in the following ranges in pg/mL: (<5.0 levels), [5.0≥ and <5.9), [5.9≥ and <6.9), [6.9≥). Ptrend before adjustment for age and sex p<0.0001, after adjustment P=0.001. (D) Follistatin level categories 1 through 4 correspond to values falling in the following ranges in pg/mL: (<4.5 levels), [4.5≥ and <5.5), [5.5≥ and <6.5), [6.5≥). Ptrend before adjustment for age and sex p=3.62×10⁻⁸, after adjustment p=0.001. The best equations predicting LBP- disability score were: = −6.2619+6.074*GDF-15; = 3.754+0.148*Vaspin; =2.9657+0.2795*Follistatin.

