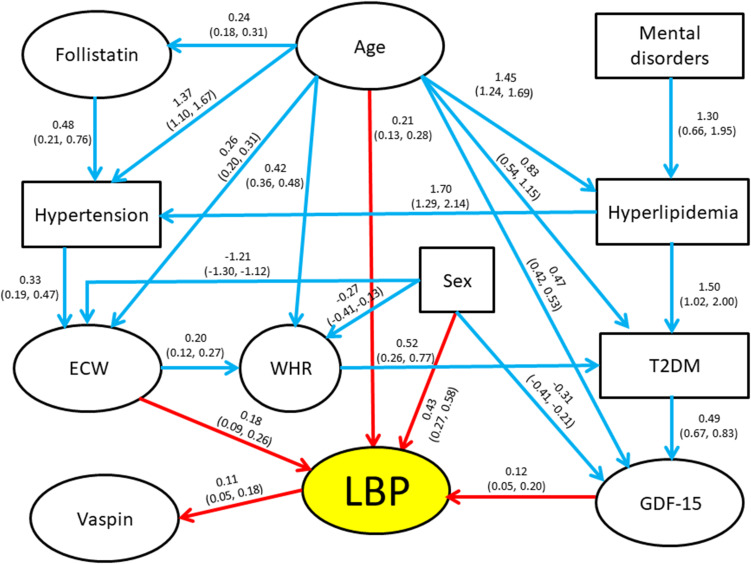
Figure 2.
Path diagram (Bayesian network modelling, ABN) exploring complex relationships between LBP-disability, age and significantly associated covariates. Directed acyclic graph among study measures. Binary variables appear in rectangles and continuous variables in ovals. All quantitative variables were standardized prior to analysis. Coefficients on the arcs (paths) between “parents” (independent variables) and “children” (dependent variables) are the modes obtained from the posterior distributions resulting from the Bayesian modeling, with the corresponding 95% credible intervals presented below in parentheses. These coefficients are analogous to regression coefficients from logistic or multiple regression models, depending on variables examined. Red arrows denote direct influences on LBP and blue arrows indicate direct influences on the other variables.

