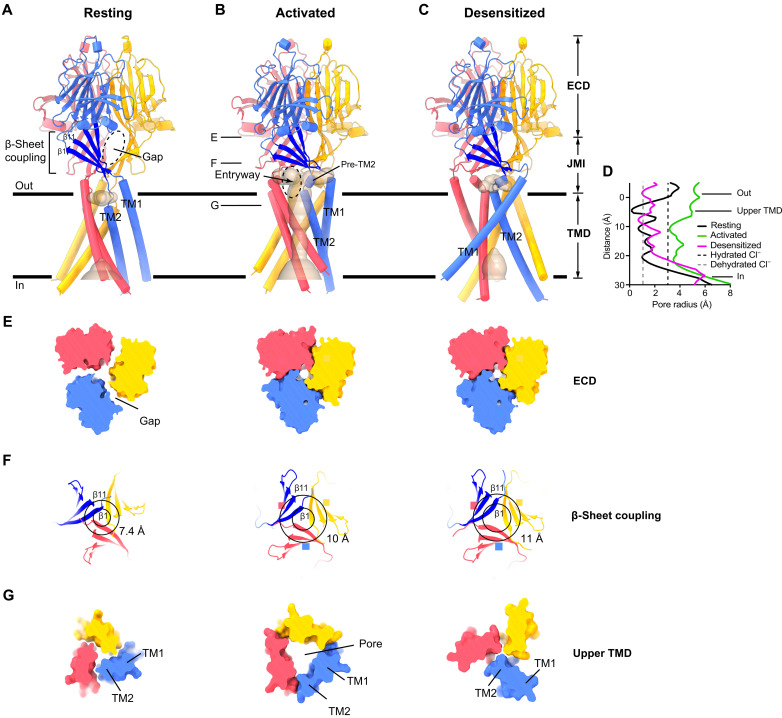
Fig. 2. Resting, activated, and desensitized conformations of ASOR.
(A to C) Cartoon representations viewed from the membrane, with subunits colored separately. Solvent-accessible surfaces within the TMD are depicted (wheat color). Only the activated conformation has a continuous pore through the membrane. Horizontal lines indicate approximate boundaries of the membrane. (D) Dimensions within the TMD of each structure, calculated along the symmetry axis as the distance to the nearest van der Waals protein contact. Dashed lines indicate the radii of hydrated and dehydrated Cl− ions. (E to G) Cross sections of the channel, showing dimensional changes in the ECD, β-sheet coupling domain, and upper TMD among the structures (left, resting; middle, activated; right, desensitized). In (E) and (G), 5-Å-thick slices of the molecular surfaces, taken at positions corresponding to “E” and “G” labels from (B) in each of the structures, are shown from the extracellular side. In (F), 10-Å-thick slices of cartoon representations of the β-sheet coupling domains, taken at position corresponding to the “F” label in (B), are shown from an intracellular perspective. Residues marking the ends of the β1 and β11 strands (attaching to TM1 and TM2) are connected by circles. Diameters of the outer circles (for β11) are indicated to highlight dilation of the β-sheet coupling domains in the activated and desensitized structures.

