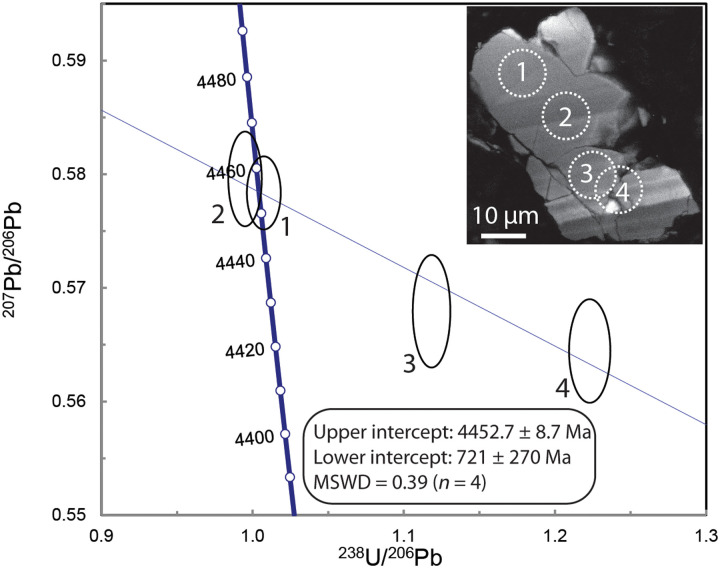
Fig. 3. U/Pb concordia diagram for the shock-deformed zircon grain in NWA 7034.
The discordia regression is defined only by the four analyses; it is not anchored by an axis intercept. The inset CL image shows location and number of the four analyses; igneous growth zoning is also visible. Uncertainty cited is 1σ.

