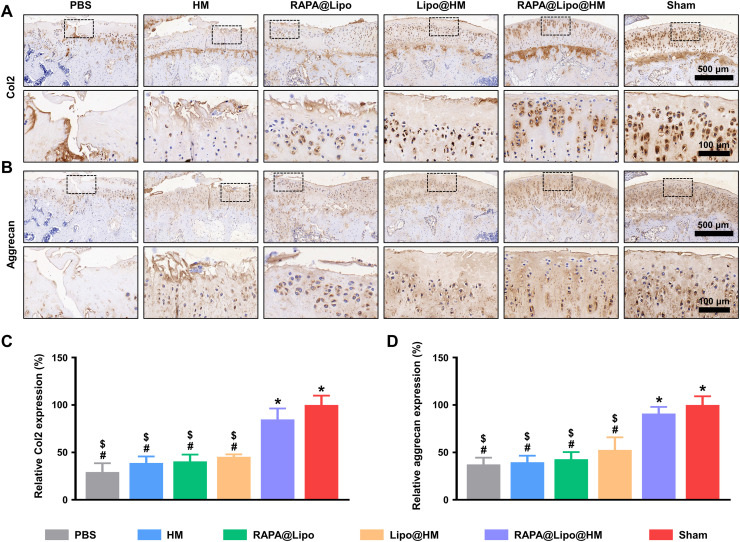
Fig. 9. Immunohistochemistry staining.
(A) Representative images of Col2 protein immunohistochemical staining. (B) Representative images of aggrecan protein immunohistochemical staining. (C) Quantification of relative Col2 expression. (D) Quantification of relative aggrecan expression (#, $, and * indicate P < 0.05 in comparison with the sham, RAPA@Lipo@HM, and PBS groups, respectively).

