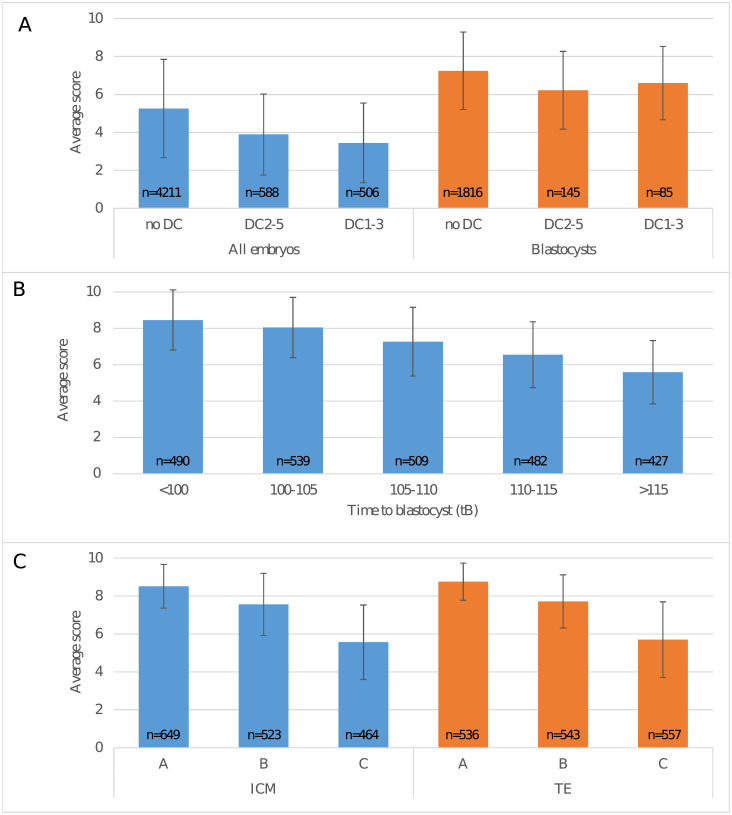
Fig 2. iDAScore for different morphokinetic groups.
(A) Average score for embryos with no direct cleavages (no DC), direct cleavage from 2 to 5 blastomeres (DC2-5) or direct cleavage from 1 to 3 blastomeres (DC1-3), respectively. Average scores are shown for the whole cohort (n = 5305) and for embryos that reached the blastocyst stage (n = 2046). (B) Average score for blastocysts (n = 2447) where time to blastocyst was <100, 100–105, 105–110, 110–115 or >115 hpi, respectively. (C) Average score for embryos (n = 1636) with ICM and TE grades A, B or C, respectively. The number of embryos in each group is shown inside the bar. Lines show the standard deviation within each group.

