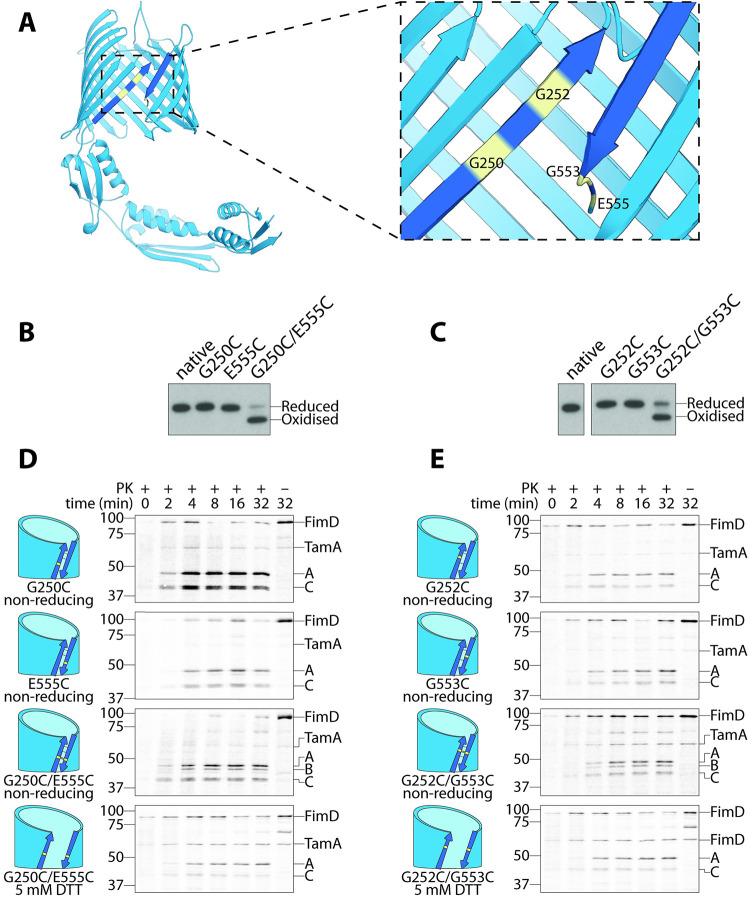
Fig 2. TamA requires a lateral gate for function.
(A) Ribbon diagram of TamA (PDB: 4C00), where the first and last β-strands representing the lateral gate have been coloured a darker shade of blue. Each cysteine substitution is highlighted in yellow. (B-C) Cells prepared for pulse chase analysis were subjected to nonreducing SDS-PAGE and immunoblotting using antibodies raised against TamA. TamA oxidation states are indicated, based on their migration speeds (NB: Oxidised TamA is more compact because it cannot be fully denatured without a reducing agent and therefore migrates faster). (D-E) FimD assembly was monitored over time by pulse chase analysis in ΔtamA cells complemented with the indicated TamA cysteine mutants. Aliquots were taken at 10 s (0 min), 2, 4, 8, 16, and 32 min and treated with proteinase K (±PK). Total protein was analysed by SDS-PAGE and storage phosphor imaging. The position of FimD and its fragments A, B, and C are indicated on the right of autoradiograms, and the protein standards are indicated on the left (sizes are kDa). A (approximately 50 kDa) and C (approximately 40 kDa) represent the N- and C-terminal fragments of correctly assembled FimD, respectively, whereas B (approximately 45 kDa) is a central fragment of an assembly intermediate of FimD that accumulates in the absence of functional TamA [38]. Where reducing conditions were required, 5 mM DTT was used to supplement media during pulse chase analysis. Each pulse chase analysis was performed with at least 3 biological replicates. (B-E) Uncropped images are presented in S1 Raw Images; original autoradiographs and immunoblots (including relevant replicates) are presented in S2 and S3 Raw Images, respectively.

