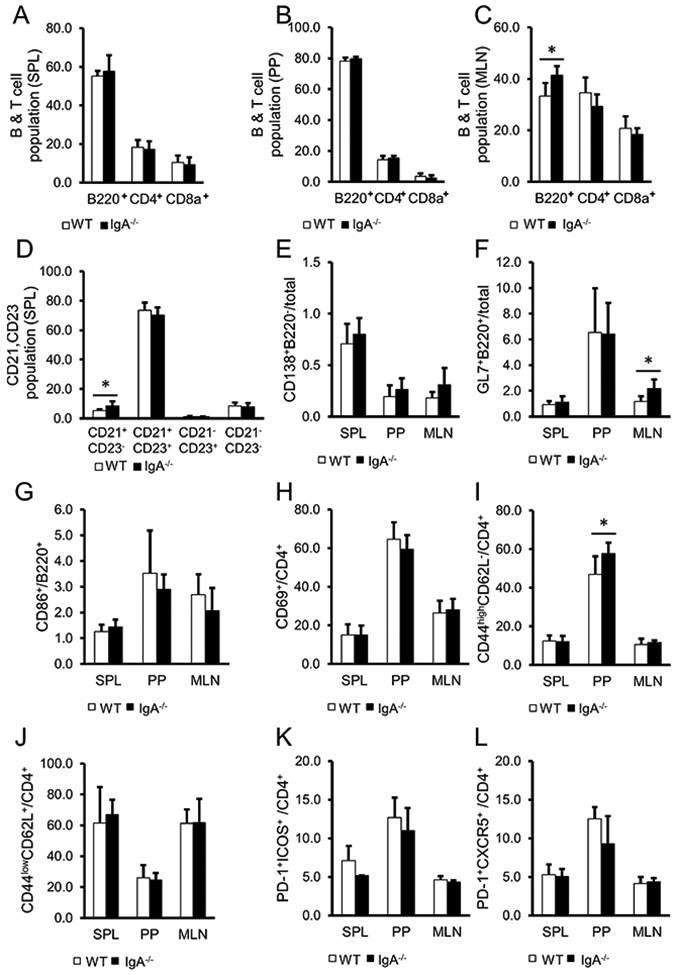
Figure 2.

Analysis of lymphoid tissue cell populations in the spleen (SPL), Peyer’s patches (PP) and mesenteric lymph nodes (MLN) in WT (open) and IgA−/− (closed). (A-C) Percentage of either B220+, CD4+ or CD8a+ cells in SPL (A), PP (B) and MLN (C). (D) Percentage of CD21+CD23− marginal zone B cells and CD21+CD23+ follicular B cells in CD19+ population at SPL. (E-L) Percentage of B220−CD138+ plasma cells (E), and B220+GL7+ germinal centre B cells (F) in total cells, CD86+ B cells in B220+ population (G), CD69+T cells (H), CD44highCD62L− effecter memory T cells (I), CD44lowCD62L+ naive T cells (J), PD-1+ICOS+ Tfh cells (K), PD-1+CXCR5+ Tfh cells (L) in CD4+ population . Data are expressed as means±SD. WT: n=7, IgA−/−: n=8. *p<0.05 (t-test).
