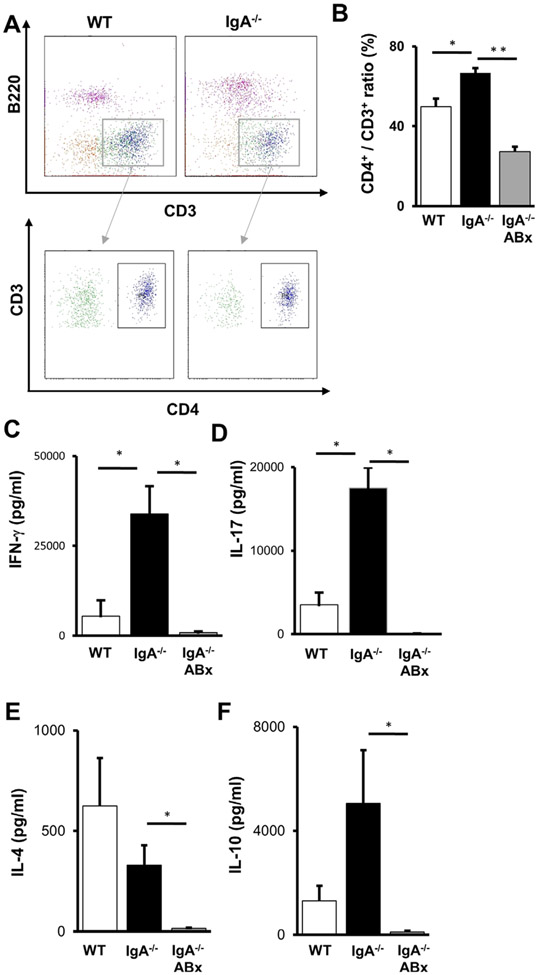
Figure 4.
Analysis of ileal lamina propria CD4+ T cells of IgA−/−. (A) Flow cytometric analysis of the ileal lamina propria lymphocytes of WT (left) and IgA−/− (right). B220−CD3+ cells were gated and then opened by CD3 and CD4. Representative data from each group are shown. (B) The ratios of stained CD3+ and CD4+ T cells from the lamina propria of WT (left), IgA−/− (middle) and ABx-treated IgA−/− (right). Data are expressed as means±SEM. (n>3). *p<0.05. **p<0.01. (C–F) Cytokine production from the ileal lamina propria CD4+ T cells of WT (left), IgA−/− (middle) and ABx-treated IgA−/− (right) after stimulation with anti-CD3e and anti-CD28 Abs. The concentrations of IFN-γ (C), IL-17 (D), IL-4 (E) and IL-10 (F) in culture supernatants were determined (n>3). Values are presented as means±SEM (n>3). N.S., not significant. *p<0.05.

