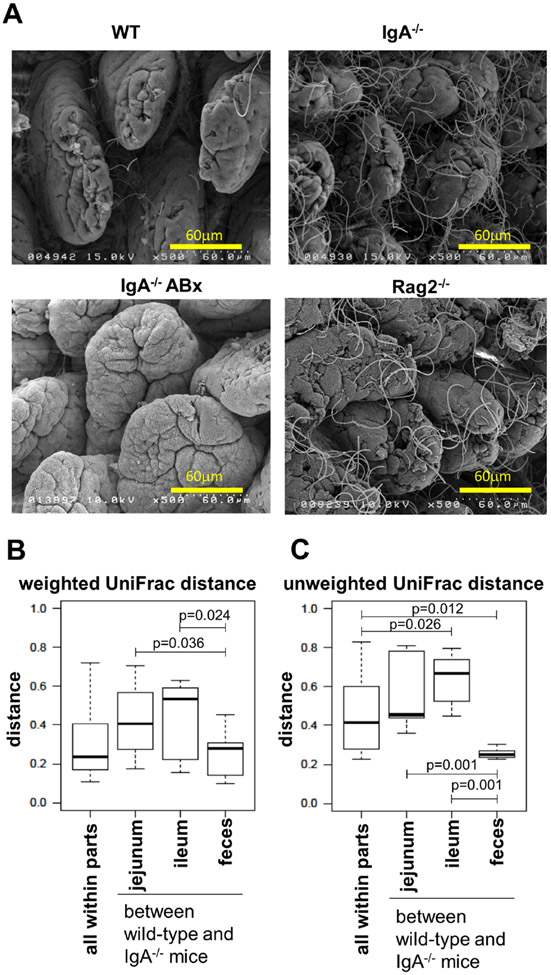
Figure 5.
Analysis of microbiota in the gut. (A) Analysis of SFB on the ileal mucosa. The ileal samples from WT (top left), IgA−/− (top right), ABx-treated IgA−/− (bottom left) and Rag2−/− (bottom right) mice were subjected to scanning electromicroscopic analysis. Representative results from each group are shown (n>3). (B and C) Weighted (B) and unweighted (C) UniFrac distances between WT and IgA−/− mice. The extracted samples from either the mixture of small intestine and colon, the isolated jejunum, ileum or faeces were subjected to metagenomic analysis as described in online supplemental materials and methods.

