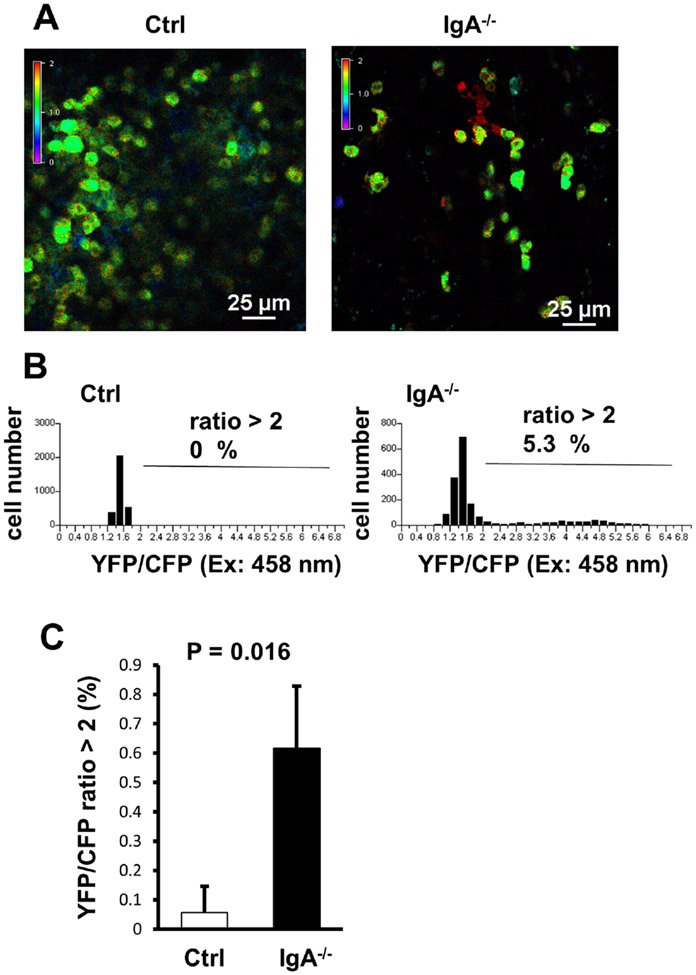
Figure 6.
Intravital imaging of Ca2+ signalling in Peyer’s patch (PP) B cells. (A) Representative images of Ca2+ signalling in the PP of the control (Ctrl, left) and IgA−/− (right) CD19-Cre/YC3.60flox mice. Intravital imaging analysis of PP was performed under a confocal microscopy. Time-lapse images were obtained at every 2 s. Representative images reflecting the Ca2+ concentration based on the YFP:CFP ratio (excitation: 458 nm) are shown (n=3). (B) Distribution of the time-integrated intracellular Ca2+ concentrations of the PP B cells from Ctrl (left) and IgA−/− (right) CD19-Cre/YC3.60flox mice (n=20, frame=147 for Ctrl; n=20, frame=89 for IgA−/−). Percentages of cells with YFP/CFP ratios >2 are indicated. (C) YFP/CFP ratiometric intensities (excitation: 458 nm) of the PP B cells from Ctrl (left) and IgA−/− (right) CD19-Cre/YC3.60flox mice. Randomly selected fields from three mice were analysed. p<0.05 (t-test).

