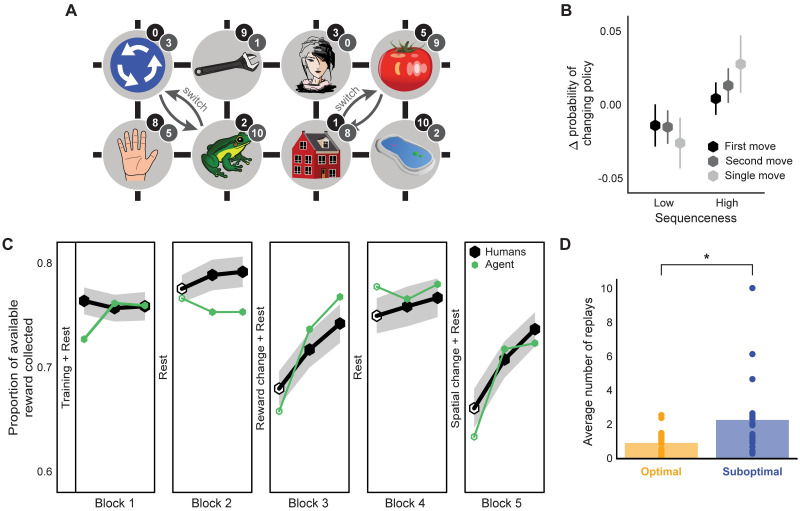
Fig 1. Task structure and replay modelling.
(A) Structure of the state-space. Numbers in black and grey circles denote the number of reward points associated with that state respectively pre- and post- the reward association change between blocks 2 and 3. Grey arrows show the spatial re-arrangement that took place between blocks 4 and 5. Note that the stimuli images shown here differ from those which the subjects actually saw. (B) Change in the probability of choosing a different move when in the same state as a function of sequenceness of the just-experienced transitions measured from the MEG data in subjects with non-negligible sequenceness (n = 25). High sequenceness was defined as above median and low sequenceness as below median. Analysis of correlation between the decoded sequenceness and probability of policy change indicated a significant dependency (Spearman correlation, M = 0.04, SEM = 0.02, p = 0.04, Bootstrap test). Vertical lines show standard error of the mean (SEM). (C) Performance of the human subjects and the agent with parameters fit to the individual subjects. Unfilled hexagons show epochs which contained trials without feedback. Shaded area shows SEM. (D) Pessimism bias in the replay choices of human subjects for which our model predicted sufficient replay (n = 20) as reflected in the average number of replays of recent sub-optimal and optimal transitions at the end of each trial (sub-optimal vs optimal, Wilcoxon rank-sum test, W = 2.49, p = 0.013). ** p < 0.01.

