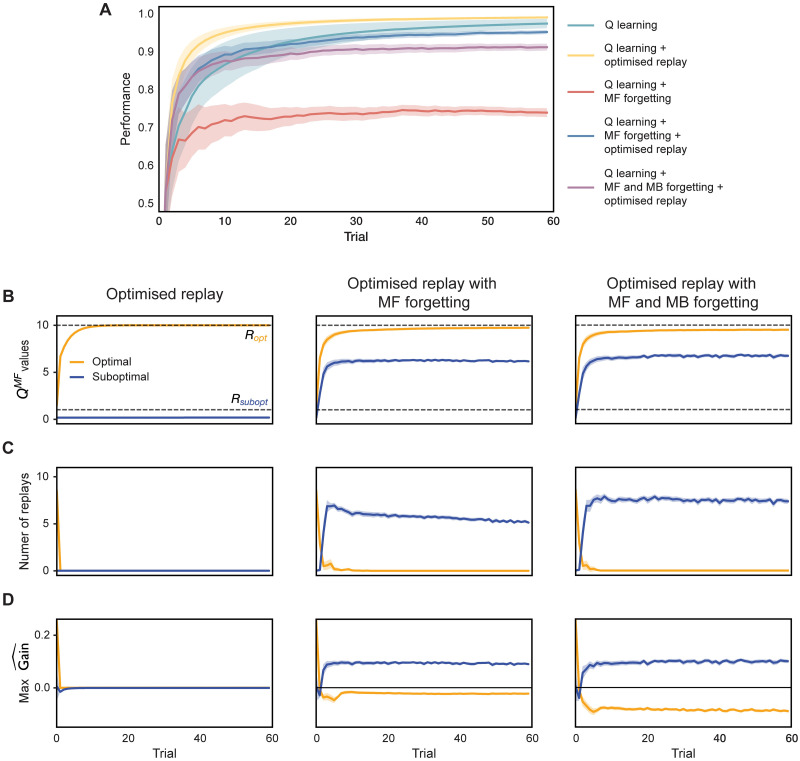
Fig 3. Incremental model comparison.
(A) Average performance (cumulative proportion of available reward obtained) of agents with varying degree of model complexity. (B) Evolution of MF Q-values during learning. Dashed grey lines indicate true reward R for each action. Blue and orange lines indicate MF Q-values for the objectively sub-optimal and optimal actions respectively. (C) Number of replays in each trial. (D) Maximal gain for objectively sub-optimal and optimal actions as estimated by the agents in each trial. Shaded areas show 95% confidence intervals.

