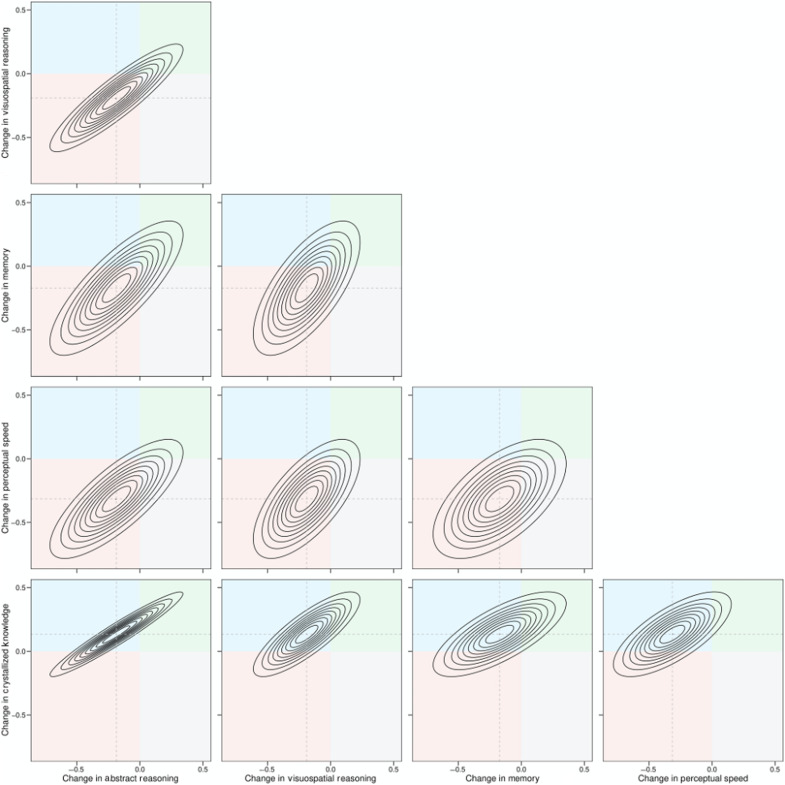
Fig. 1. Bivariate density plots of association between individual rates of change in different cognitive abilities in VCAP, as implied by the multivariate growth curve model.
Each concentric band represents 10% of the bivariate distribution of the linear rate of per decade change at age 50 years. The colored quadrants indicate regions of the distribution in which both abilities decline (bottom left quadrant; red), the ability on the x axis declines but the ability on the y axis increases (top left quadrant; blue), both abilities increase (top right quadrant; green), and the ability on the x axis increases and the ability on the y axis decreases (bottom right quadrant; gray). In all panels, strong positive associations between individual rates of change in different abilities are evident. For the associations between rates of change in different fluid abilities, it can be seen that each bivariate distribution is centered over the red quadrant in which both abilities decline. However, for the associations between rates of change in crystallized ability and each fluid ability (bottom row of panels), up to approximately half of each distribution occupies the blue quadrant, in which the fluid ability declines and crystallized ability increases.

