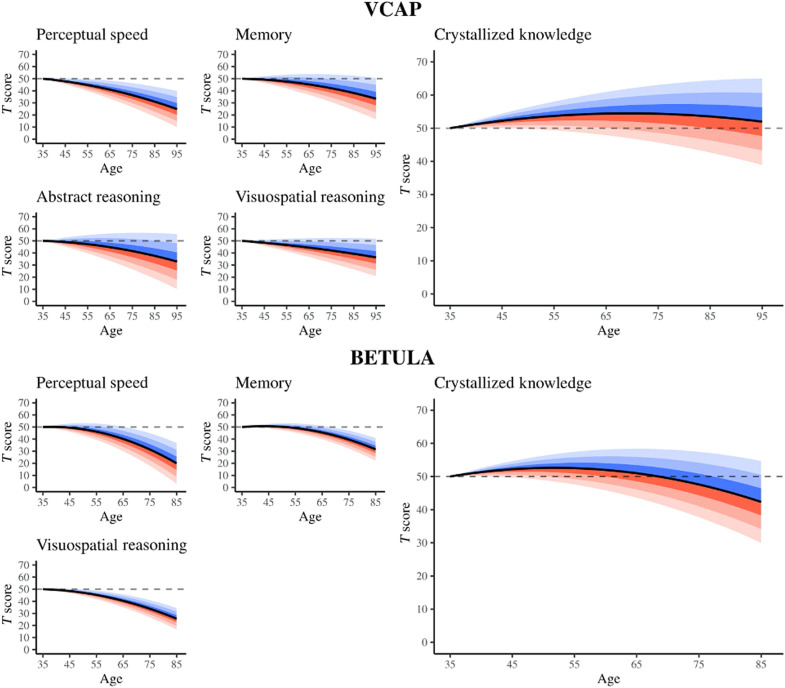
Fig. 3. Trajectories of change in each ability domain stratified across the distribution of variation in the general factor of fluid decline.
Trajectories are presented for the VCAP (top) and the BETULA study (bottom). The black curves represent the population average trajectories for each domain. Blue shading represents shallower-than-average rates of general fluid declines, whereas red shading represents steeper-than-average rates of general fluid declines. Each increment of shading corresponds to a 0.5 SD shift in the general factor of fluid decline. More saturated colors correspond to more densely concentrated regions of the distribution of change. All variables are on a T score metric, such that the mean of the age and age-squared residualized scores is 50, and the SD is 10. All trajectories were centered such that they begin at T score = 50 at age 35 years. It can be seen that individuals who exhibit relatively shallow rates of fluid decline exhibit some of the most positive rates of gain in crystallized ability, whereas those who exhibit relatively steep rates of fluid decline exhibit very little gain, or even decline, in crystallized ability over the same period of time.

