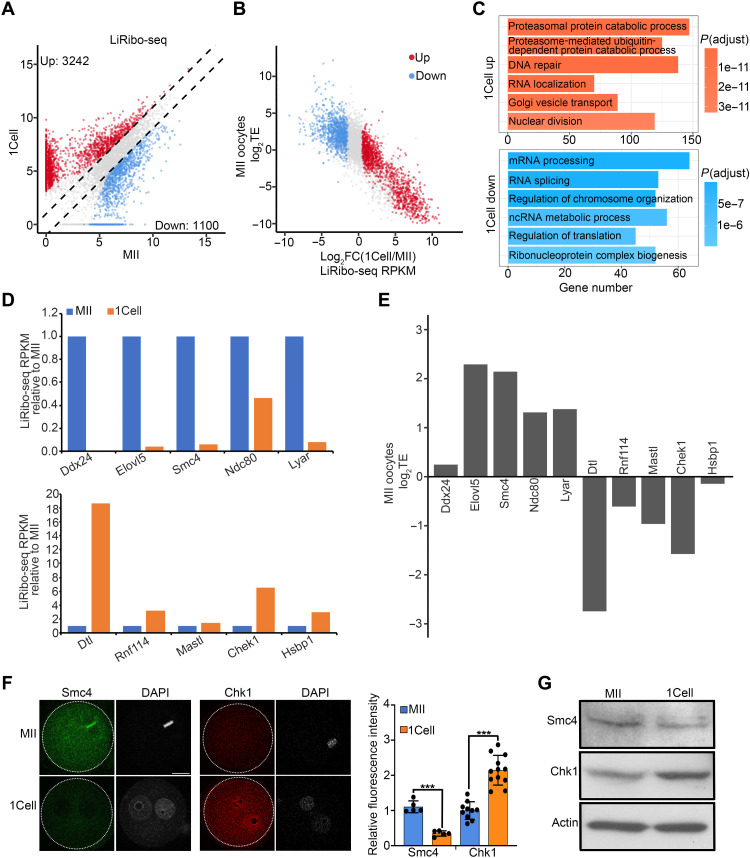
Fig. 3. A translational switch during MII to zygote transition.
(A) Scatterplot showing the differentially translated genes between MII oocytes and zygotes. Fold change ≥ 2, false discovery rate (FDR) < 0.01. Red and blue dots indicate mRNAs whose translation from MII oocytes to zygotes was up- and down-regulated, respectively. The x and y axes are log2-transformed normalized read counts. (B) Scatterplot showing the relationship between TE in MII oocytes and translational fold change of differentially translated genes from MII oocytes to zygotes. Red and blue dots indicate mRNAs whose translation from MII oocytes to zygotes were up- and down-regulated in (A), respectively. (C) Gene ontology enrichment analysis of the maternal mRNAs that was translationally up- and down-regulated during MII oocyte–to–zygote transition. The enriched terms are ranked by adjusted P value. (D) Bar graph showing the relative translational levels of some maternal mRNAs down-regulated (top) and up-regulated (bottom) in zygotes. (E) Bar graph showing the log2TE of genes in (D) at the MII stage. (F) Left panels showing representative images of immunostaining of Smc4 and Chk1 in MII oocytes and zygotes. Scale bar, 20 μm. Right panel showing the quantification of relative fluorescence intensity. ***P < 0.001. (G) Western blot showing Smc4 and Chk1 protein levels in MII oocytes and zygotes.

