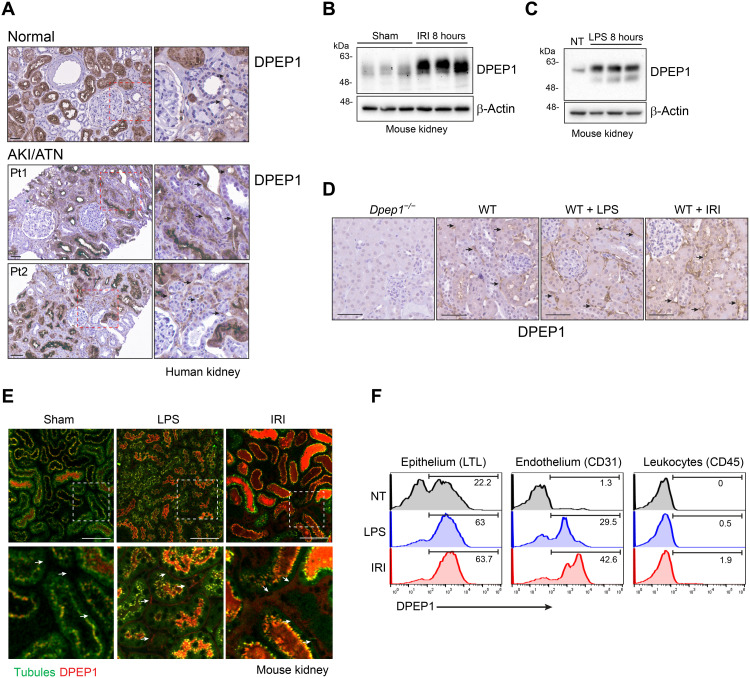
Fig. 1. DPEP1 expression in the kidney.
(A) DPEP1 immunohistochemistry in normal human kidney and allograft biopsies with clinical ATN/acute tubular necrosis (ATN). Arrows denote peritubular capillaries. Pt1 and Pt2 denote biopsies from 2 individual patients. Scale bars, 50 μm. Right panels are magnification of hatched boxes. (B and C) Immunoblot probing for DPEP1 in kidney lysates from mice treated with renal IRI and lipopolysaccharide (LPS) at 8 hours. Sham and untreated (NT) mice are controls. (D) DPEP1 immunohistochemistry in wild-type (WT) mouse kidneys following IRI or LPS treatment at 8 hours. Kidney from untreated Dpep1−/− mouse is used as a control. Arrows denote peritubular capillaries. Scale bars, 50 μm. (E) Kidney IVM in mice following sham operation, LPS administration, and IRI (8 hours). Tubules are visualized using autofluorescence and DPEP1 expression by fluorescent-labeled LSALT peptide. Arrows denote peritubular capillaries. Labels: tubules (green) and DPEP1 (red). Scale bars, 100 μm. Bottom panels are magnification of hatched boxes. (F) Representative flow cytometry for DPEP1 expression in cells isolated from the kidneys of untreated (NT), LPS-, or IRI-treated mice (8 hours). Cells sorted using LTL (proximal tubular epithelial cells), CD31 (endothelial cells), and CD45 (leukocytes).

