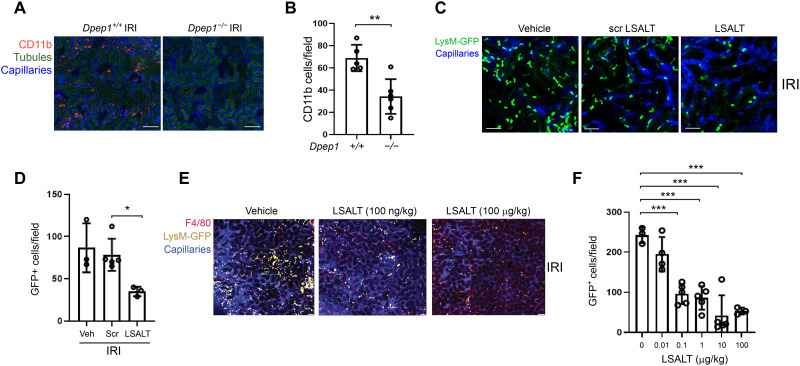
Fig. 2. DPEP1 and leukocyte recruitment during kidney IRI.
(A) Kidney IVM in Dpep1+/+ and Dpep1−/− mice at 2 hours following renal IRI. Labels: leukocytes (CD11b, red), tubules (autofluorescence, green), and capillaries (QTracker, blue). Scale bars, 100 μm. (B) Quantification of stationary CD11b+ cells/field in the kidney (Dpep1+/+ versus Dpep1−/−, **P = 0.003, n = 5 to 6 per group, Student’s t test). (C) Kidney IVM in LysMgfp/gfp mice 2 hours following IRI. Mice were pretreated with vehicle (phosphate-buffered saline), scrambled (Scr) LSALT peptide, or LSALT peptide. Labels: leukocytes (LysM-GFP, bright green) and capillaries (QTracker, blue). Scale bars, 50 μm. (D) Quantification of stationary GFP+ leukocytes/field in the kidneys of mice 2 hours after IRI treatment with vehicle, LSALT peptide, or scrambled LSALT peptide (LSALT peptide versus scrambled peptide, *P = 0.03, n = 3 to 5). (E) Kidney IVM and (F) quantification of stationary GFP+ leukocytes in LysMgfp/gfp mice 2 hours after IRI treatment with increasing doses of LSALT peptide. Labels: macrophages (F4/80, red), leukocytes (LysM-GFP, yellow), tubules (autofluorescence, dark green), and capillaries (QTracker, blue) [LSALT peptide 0 μg/kg versus 0.1 μg/kg, ***P = 0.0002; 1 μg/kg, ***P = 0.0001; 10 μg/kg, ***P = 0.0003; 100 μg/kg, ***P = 0.0001; n = 3 to 5 per group, analysis of variance (ANOVA) with Dunnett’s post hoc test].

