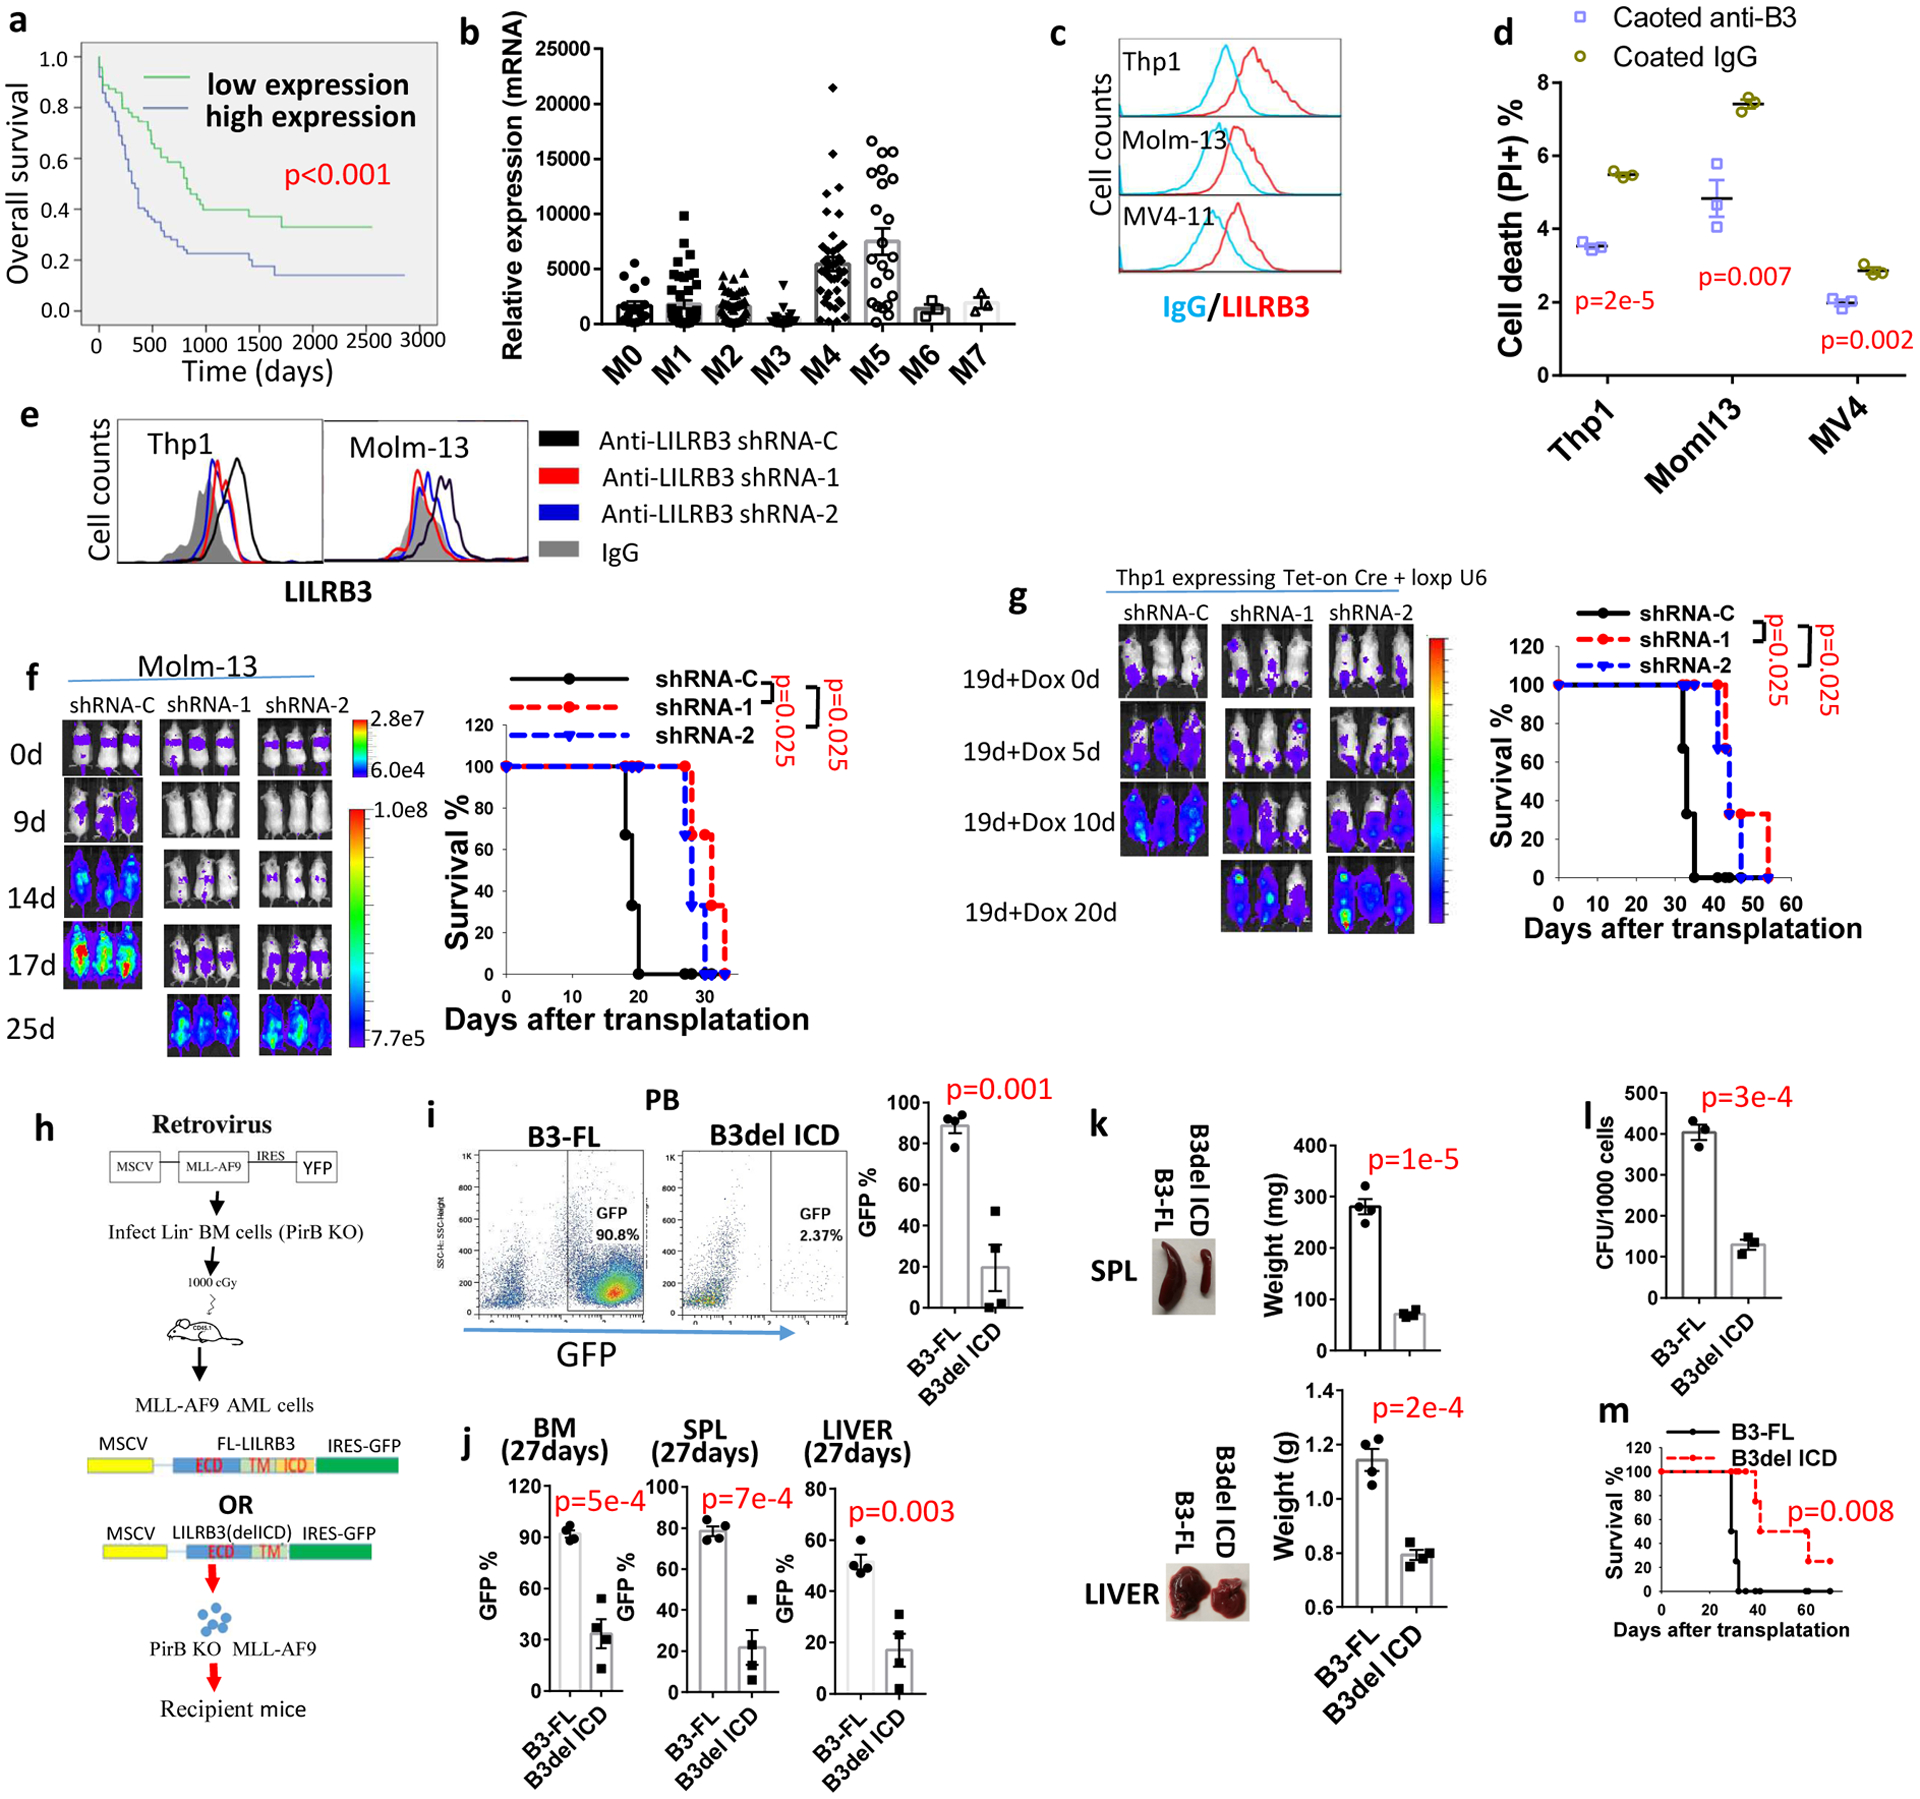
Fig. 1 |. LILRB3 promotes monocytic AML progression.

a, Overall survival of AML patients grouped based on LILRB3 expression; data from the TCGA database were analyzed. b, Relative LILRB3 expression in different AML subtypes (mRNA expression normalized to GAPDH); data from the TCGA database. c, LILRB3 expression on AML cell lines. d, Percentages of dead cells in AML cultures treated with anti-LILRB3 antibody or IgG (n=3 independent cell cultures). e, LILRB3 expression on AML cells expressing control shRNA (shRNA-C) or LILRB3-specific shRNAs (shRNA-1 or −2). f, Left: Whole-body images for luciferase of NSG mice engrafted with Molm13 cells expressing luciferase and indicated shRNAs over time. Right: Survival of mice (n=3 independent mice). g, Left: Images of NGS mice engrafted with THP-1 AML and treated with dox at 19 days (once, gavage 2 mg/mouse) post-engraftment to induce shRNA expression. Right: Survival of mice (n=3 independent mice). h, Schematic of retroviral vector used to create a mouse model to study the function of LILRB3. i, Representative FACS analyses and plot of percentages of GFP+ AML cells expressing B3-FL and B3del ICD in peripheral blood of engrafted mice (normal peripheral blood sample as a negative control for gating GFP positive population). j, Percentages of GFP+ AML cells expressing B3-FL and B3del ICD in bone marrow (BM), spleen (SPL), and liver of mice at 27 days after engraftment (n=4 independent mice). k, Representative images and average weights of spleen and liver of mice engrafted with GFP+ AML cells expressing B3-FL and B3del ICD at 27 days (n=4 independent mice). l, Clone forming assay (CFU) of GFP+ AML cells expressing B3-FL or B3del ICD isolated from bone marrow (n=3 independent cell cultures). m, Survival of the mice engrafted with AML cells expressing B3-FL and B3del ICD (n=4 independent mice). The data are presented as mean ± s.e.m, and p values were calculated by two-tailed t-test except for a, f, g and m by log-rank test.
