
Fig. 5|. LILRB3 enhancement of NF-κB signaling depends on cFLIP.
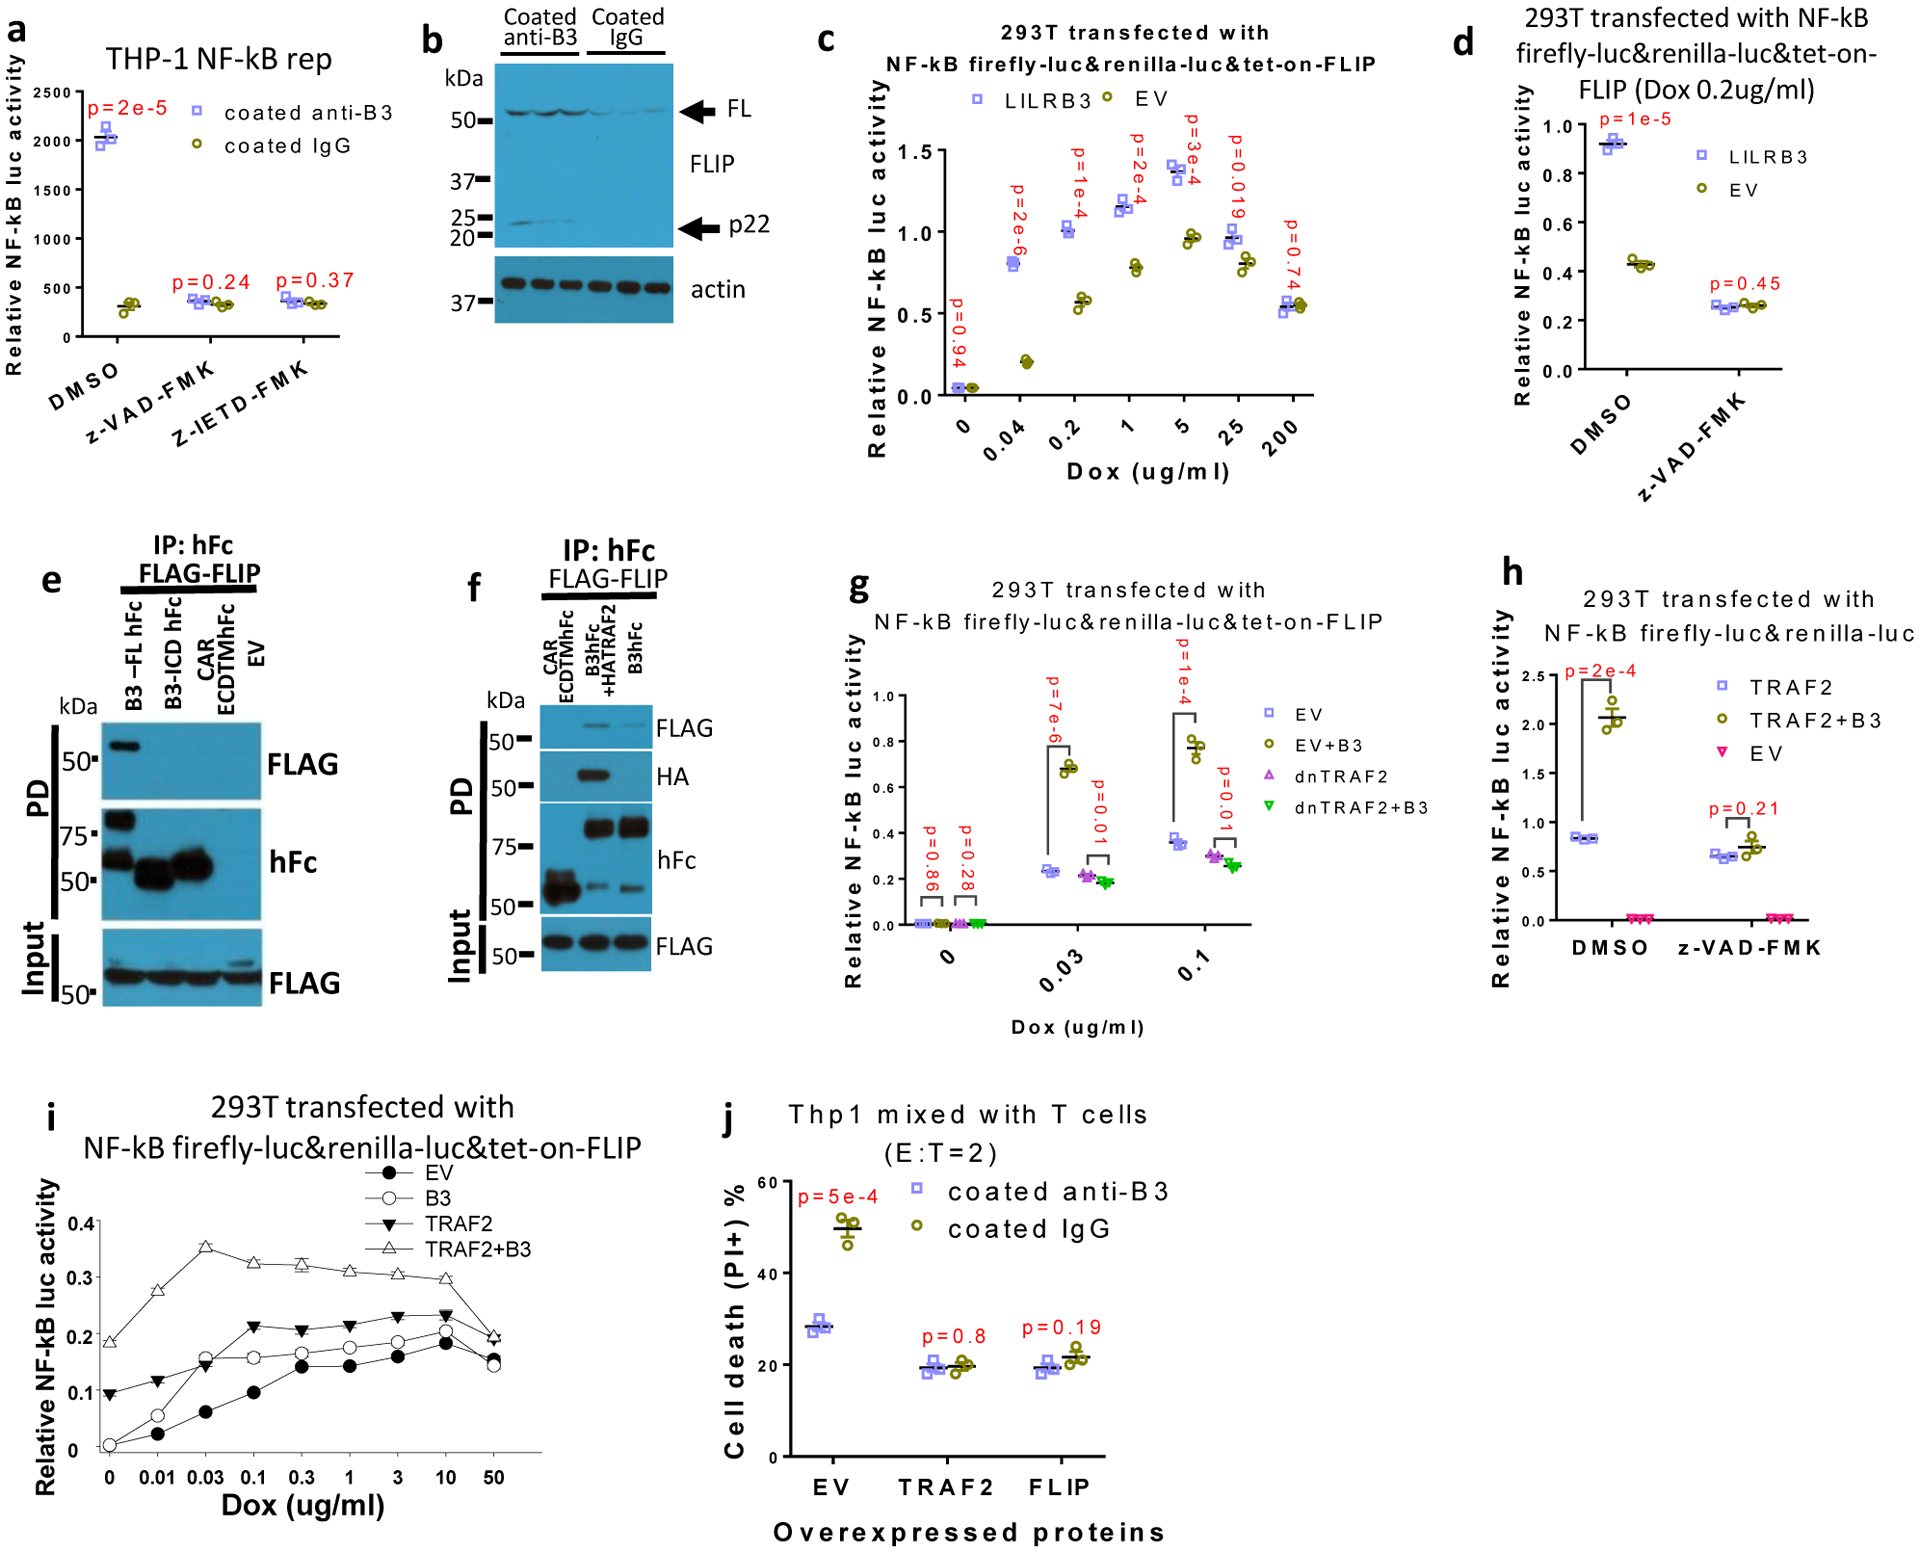
a, NF-κB reporter gene activities in THP-1-Lucia™ cells activated with anti-LILRB3 antibody or IgG in the presence of DMSO, caspase inhibitor z-VAD-FMK, or caspase 8 inhibitor z-IETD-FMK (n=3 independent cell cultures). b, Western blot analysis for cFLIP in THP-1 cells activated by anti-LILRB3 antibody or IgG. c, Relative NF-κB reporter gene activities in 293T cells co-transfected with tet-on cFLIP plus empty vector (EV) or vector for expression of LILRB3 at different concentration of dox (n=3 independent experiments). d, Relative NF-κB reporter gene activities in 293T cells co-transfected with tet-on cFLIP plus empty vector or vector for expression of LILRB3 in the presence of DMSO or z-VAD-FMK (with 0.2 ug/ml of dox) (n=3 independent experiments). e, Co-immunoprecipitation assay of exogenously expressed FLAG-cFLIP and hFc-tagged B3-FL or B3del ICD in 293T cells. f, Co-immunoprecipitation assay of exogenously expressed FLAG-cFLIP and LILRB3-hFc in the presence of HA-TRAF2 or empty vector in 293T cells. g, Relative NF-κB reporter gene activities in 293T cells co-transfected with tet-on cFLIP in the presence of LILRB3 and dnTRAF2 or empty vector at different concentrations of dox (n=3 wells). h, Relative NF-κB reporter gene activities in 293T cells co-transfected with TRAF2 or LILRB3 in the presence of DMSO or z-VAD-FMK (n=3 independent experiments). i, Relative NF-κB reporter gene activities in 293T cells co-transfected with tet-on cFLIP in the presence of LILRB3 and TRAF2 or empty vector at different concentrations of dox (n=3 independent experiments). j, CFSE-stained THP-1 cells with forced expression of TRAF2, FLIP or empty vector (EV) were co-cultured with activated T cells in plates coated with anti-LILRB3 or IgG for 12 hours before cell death analysis. The plots are of percent dead cells in CSFE positive cells (n=3 independent experiments). The data are presented as mean ± s.e.m, and p values were calculated by two-tailed t-test.