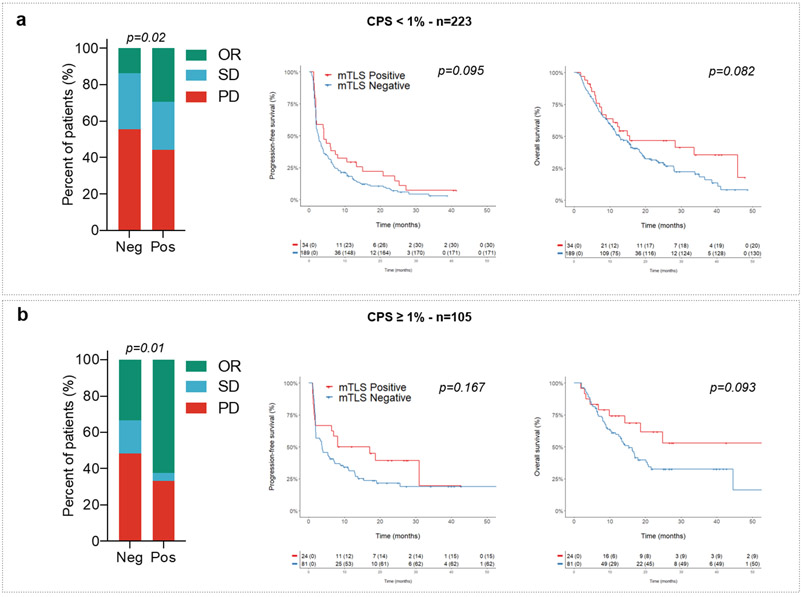
Extended Data Fig. 2. Predictive value of TLS status according to CPS PD-L1 scores.
Objective response rates (OR: objective response, SD: stable disease; PD: progressive disease; chi squared (χ2) test) and Kaplan-Meier curves of progression-free survival (log-rank test) and overall survival (log-rank test) of 328 cancer patients treated with anti-PD1/PD-L1 antagonists according to CPS PD-L1 scores (a: CPS PD-L1 <1, N=223 patients; b: CPS PD-L1 ≥ 1, N=105 patients) and TLS status (red curve: mature-TLS positive tumors; blue line: mature-TLS negative tumors).

