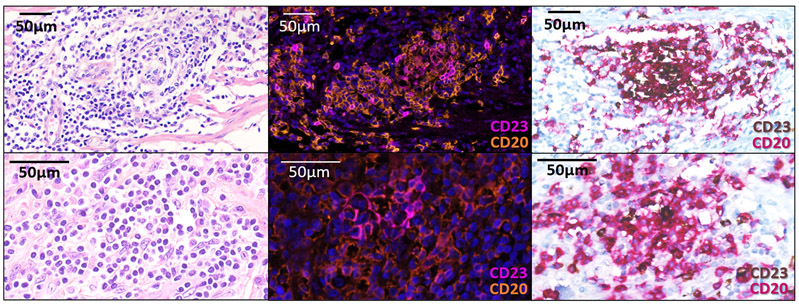
Extended Data Fig. 5. Comparison of the TLS screening with pathology and immunohistochemistry pathology versus the screening with immunofluorescence (method by Petitprez et al).
First line: conspicuous mature TLS with CD23+ follicular dendritic cells network. Second line: mature TLS defined by isolated CD23+ cell displaying dendritic morphology. Pictures from the left to right column correspond to 1) Hematoxylin Eosin Saffron (HES) staining, 2) Multiplex immunofluorescence assay of CD23 (pink) and CD20 (orange), 3) Double immunohistochemistry staining of CD23/CD20 (CD23 in brown, CD20 in red). The scale bars on the HES images indicate 50μm in size. Representative of 540 tumors analyzed (Discovery cohort n=328, validation cohort A n=131, validation cohort B n=81).

