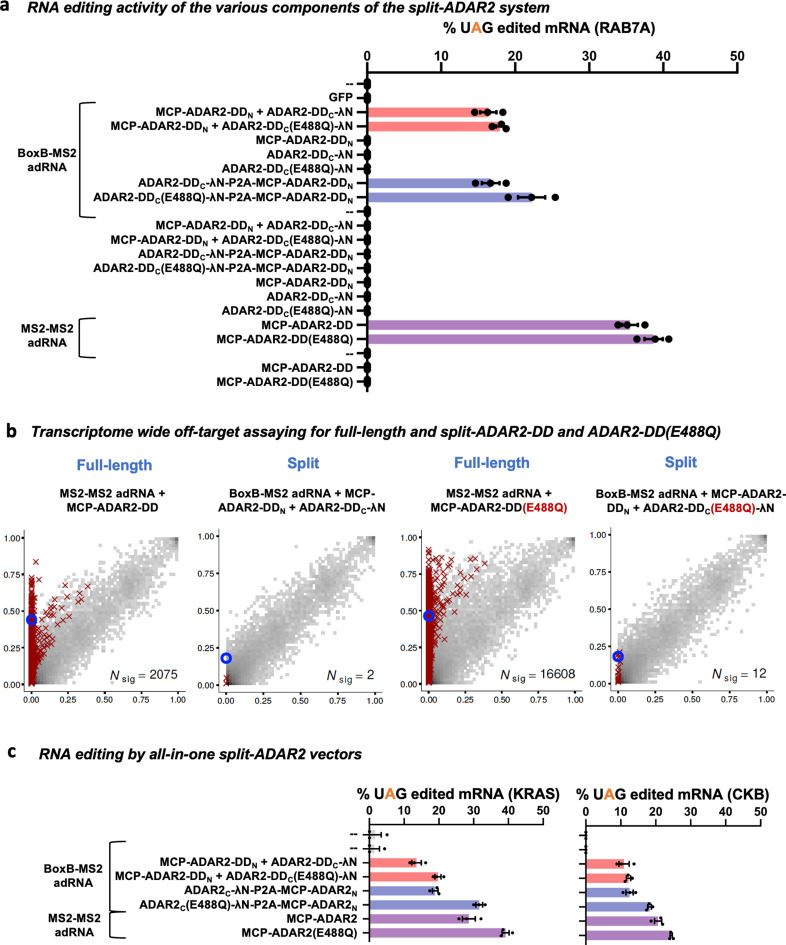
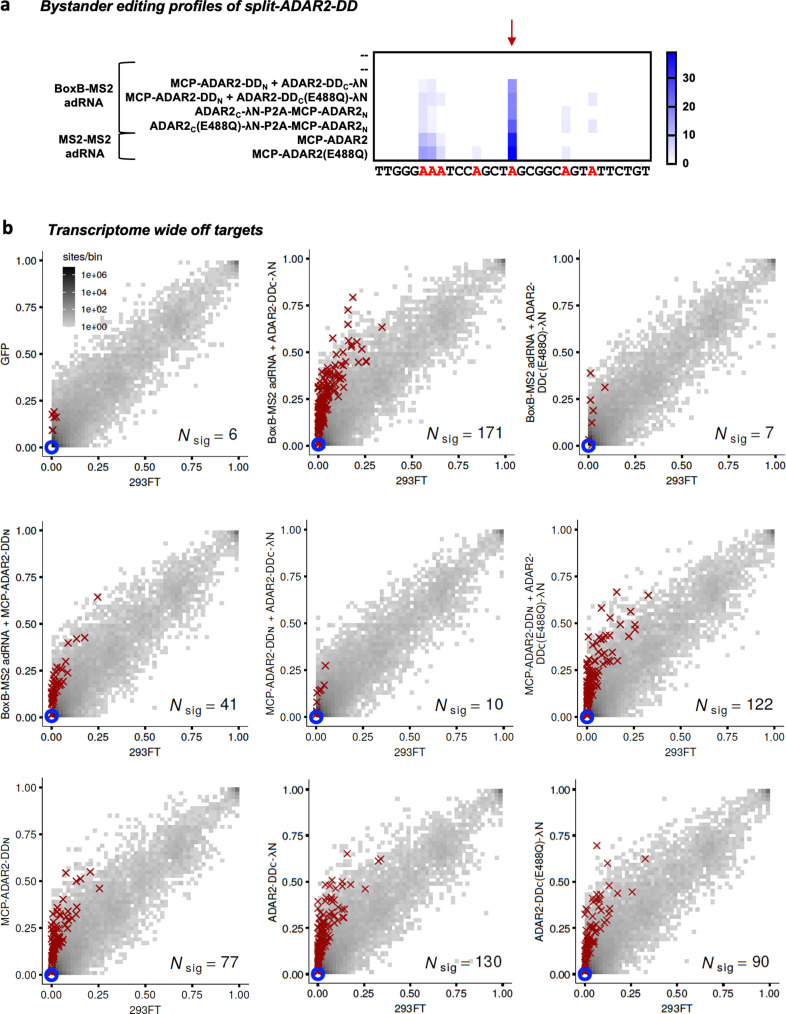
Figure 3. Characterizing the split-ADAR2 deaminase domains.
(a) The components of the split-ADAR2 system based on pair 12 were tested for their ability to edit the RAB7A transcript. Editing was observed only when every component was delivered. Values represent mean ± SEM (n = 3). (b) 2D histograms comparing the transcriptome-wide A-to-G editing yields observed with each construct (y-axis) to the yields observed with the control sample (x-axis). Each histogram represents the same set of reference sites, where read coverage was at least 10 and at least one putative editing event was detected in at least one sample. Bins highlighted in red contain sites with significant changes in A-to-G editing yields when comparing treatment to control sample. Red crosses in each plot indicate the 100 sites with the smallest adjusted p-values. Blue circles indicate the intended target A-site within the RAB7A transcript. (c) The split-ADAR2 system was assayed for editing the KRAS and CKB transcripts. Values represent mean ± SEM (n = 3). All experiments were carried out in HEK293FT cells.


