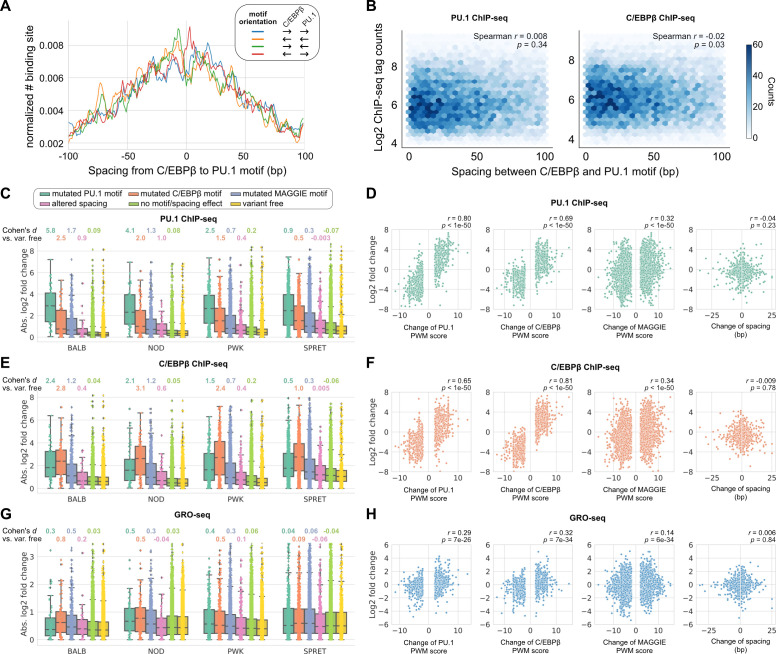
Figure 3. Effects of spacing alterations resulting from natural genetic variation across mouse strains.
(A) Spacing distributions of PU.1 and C/EBPβ binding sites at co-binding sites. (B) Density plots showing the relationship between transcription factor (TF) binding activity and motif spacing for the co-binding sites. Log2 chromatin immunoprecipitation sequencing (ChIP-seq) tags were calculated within 300 bp to quantify the binding activity of PU.1 and C/EBPβ. The color gradients represent the number of sites. Spearman’s correlation coefficients together with p-values are displayed. (C, E, G) Absolute log2 fold changes of ChIP-seq tags between C57 and another strain for (C) PU.1 binding, (E) C/EBPβ binding, or (G) nascent transcripts measured by GRO-seq. Boxplots show the median and quartiles of every distribution. Cohen’s d effect sizes comparing against variant-free regions are displayed on top. (D, F, H) Correlations between change of spacing or position weight matrix (PWM) score and change of (D) PU.1 binding, (F) C/EBPβ binding, or (H) nascent transcript level. Spearman’s correlation coefficients together with p-values are displayed.
Figure 3—figure supplement 1. Size distributions of insertions and deletions (InDels) at PU.1 and C/EBPβ co-binding sites across mouse strains.
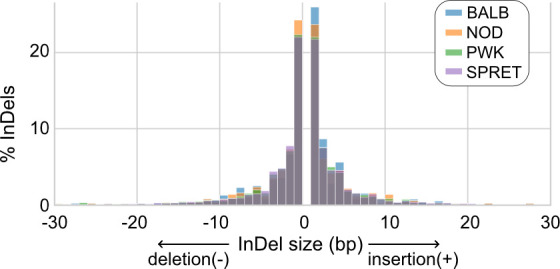
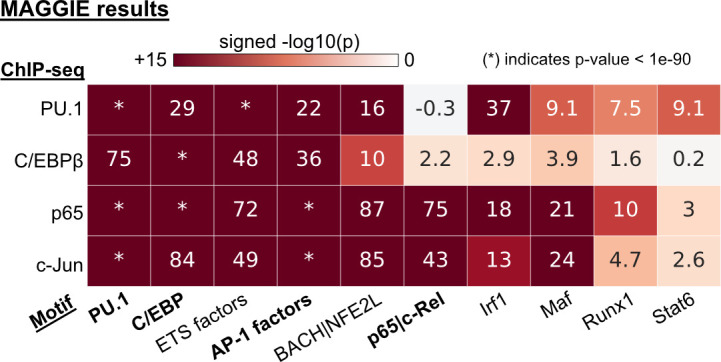
Figure 3—figure supplement 2. Functional motifs identified by MAGGIE for different transcription factor (TF) binding.
