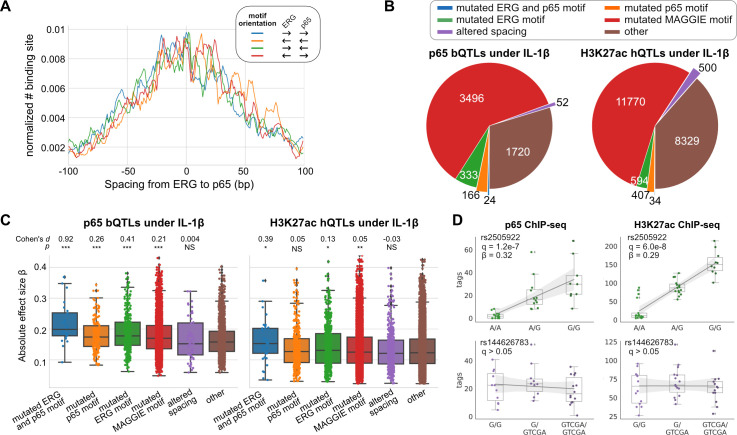
Figure 4. Effects of chromatin quantitative trait loci (QTLs) in human endothelial cells.
(A) Spacing distributions of ERG and p65 binding sites at co-binding sites. (B) Classification of chromatin QTLs based on the impacts on motif and spacing. (C) Absolute correlation coefficients of different QTLs. Cohen’s d and Mann–Whitney U test p-values comparing against the ‘other’ group are displayed on top. *p < 0.01, **p < 0.001, ***p < 0.0001. (D) Example QTLs for large effect size due to ERG motif mutation (upper) and trivial effect due to spacing alteration (lower).
Figure 4—figure supplement 1. Functional motifs identified by MAGGIE based on binding quantitative trait loci (bQTLs).
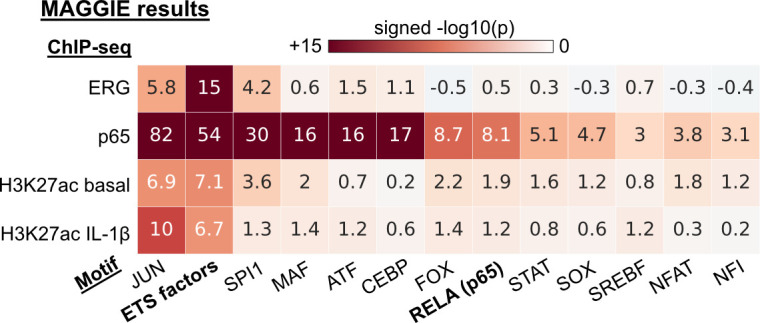
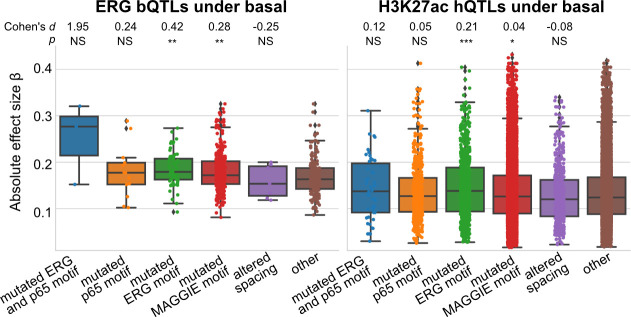
Figure 4—figure supplement 2. Classification of chromatin quantitative trait loci (QTLs) based on the effects on motif and spacing for basal condition.
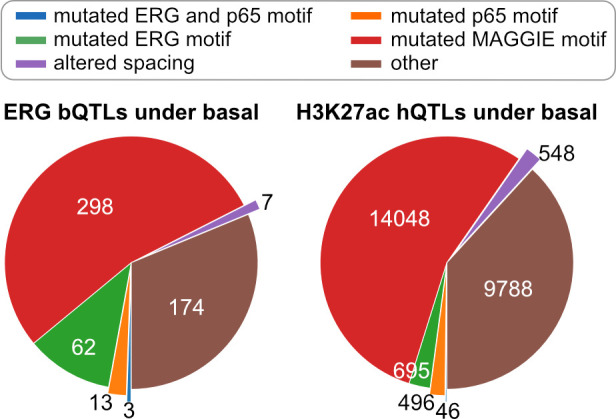
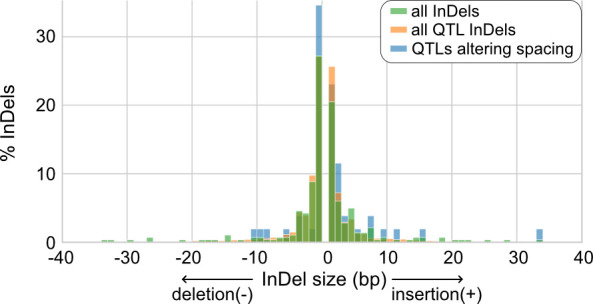
Figure 4—figure supplement 3. Size distributions of insertions and deletions (InDels) from human endothelial cell donors.
