. 2022 Jan 20;11:e70878. doi: 10.7554/eLife.70878

Figure 5. Effects of variable sizes of synthetic spacing alterations.

(A) Schematic for generating and analyzing synthetic spacing alterations. (B) The distributions of valid read counts from the input sample based on the InDel sizes of the reads. Negative InDel size indicates deletion, and positive size means insertion. (C) Log2 odds ratios by comparing C/EBPβ chromatin immunoprecipitation sequencing (ChIP-seq) reads and input sample reads. Y = 0 indicates where transcription factor (TF) binding has an expected amount of activity. p-Values were based on two-sample t-tests by comparing the InDel groups of each test region. (D) Sequencing data of ER-HoxB8 cells at co-binding site of PU.1 and C/EBPβ. Highlighted is test region #6 whose DNA sequence from PU.1 binding site to C/EBPβ binding site is shown. (E) Log2 odds ratios of test regions #6 as a function of InDel size.

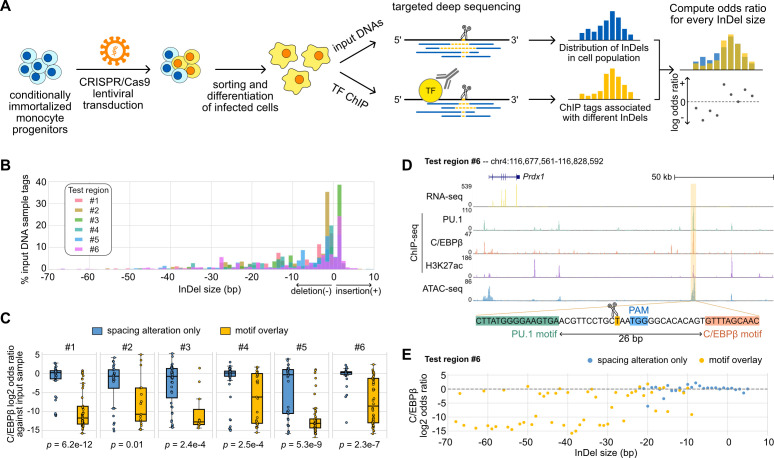
Figure 5—source data 1. Raw chromatin immunoprecipitation sequencing (ChIP-seq) tag counts associated with different sizes of insertions and deletions (InDels).

Figure 5.

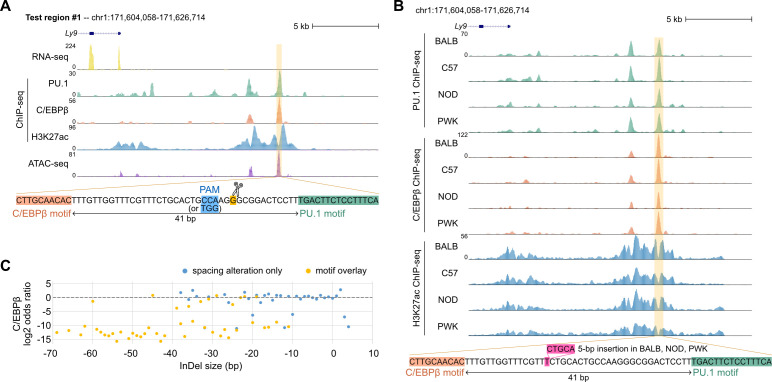
Figure 5—figure supplement 1. Effects of synthetic spacing alterations for test region #1.

Figure 5—figure supplement 1.

(A) Mouse strains data for test region #1. (B) Sequencing data of ER-HoxB8 cells for test region #1. (C) Log2 odds ratios of test region #1 as a function of InDel size.
Figure 5—figure supplement 2. Effects of synthetic spacing alterations on PU.1 binding.

Figure 5—figure supplement 2.

(A) Log2 odds ratios by comparing PU.1 chromatin immunoprecipitation sequencing (ChIP-seq) reads and input sample reads. Y = 0 indicates where transcription factor (TF) binding has an expected amount of activity. p-Values were based on two-sample t-tests between the insertion and deletion (InDel) groups of each test region. (B) Log2 odds ratios of test region #6 as a function of InDel size based on PU.1 ChIP-seq.