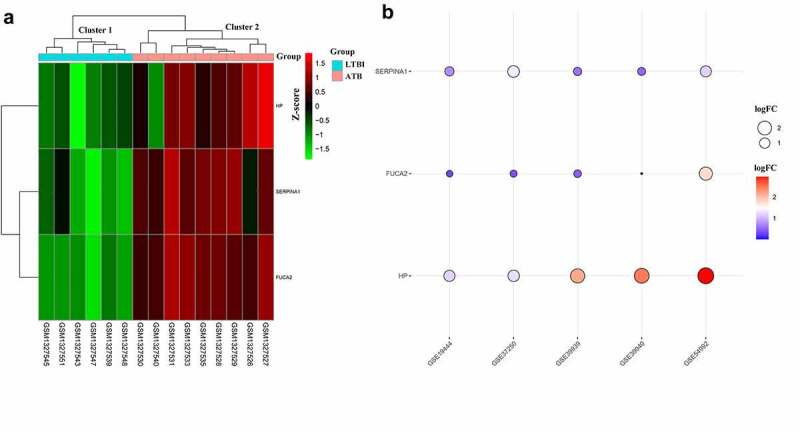
Figure 4.

Expression patterns of hub DEMonRGs between latent and active tuberculosis peripheral blood samples. (a) The heat map for unsupervised hierarchical clustering of the three hub DEMonRGs in GSE54992. (b) Validation of the hub DEMonRGs in other GEO datasets
