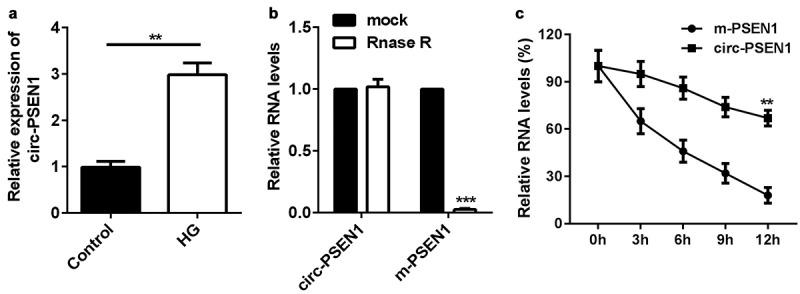
Figure 1.

Elevation of circ-PSEN1 by HG treatment in ARPE19 cells. (a) RT-qPCR determined expression levels of circ-PSEN1 in the ARPE19 cells treated with normal level glucose and HG for 48 hours. (b) The RNA levels of circ-PSEN1 and linear PSEN1 were measured by RT-qPCR after RNase R was incubated with the total cellular RNA. Mock treated cells were used as the negative control. (c) Relative RNA levels of circ-PSEN1 and PSEN1 were recorded 0, 4, 8, 12, 24 h after the cells were treated by actinomycin D. Data are representative of three experiments. **P < 0.01; ***P < 0.001. HG, high glucose; ARPE19, adult retinal pigment epithelial cell line-19; Act D, actinomycin D
