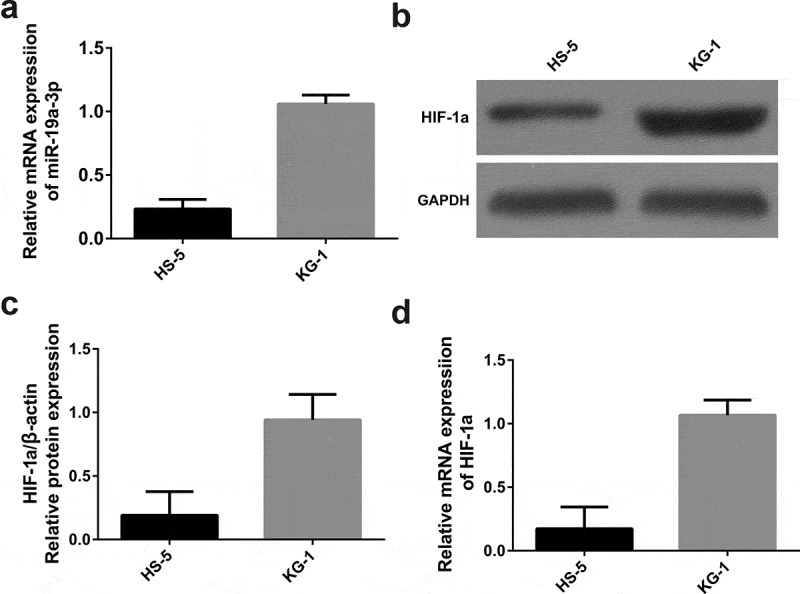
Figure 1.

miR-19a-3p and HIF-1α expression. (a) The levels of HIF-1α were determined by WB (b) and qRT-PCR (c) MiR-19a-3p mRNA level was detected through qRT-PCR. (d) Results pointed out miR-19a-3p and HIF-1α levels in KG-1 cells were higher than HS-5 cell lines
