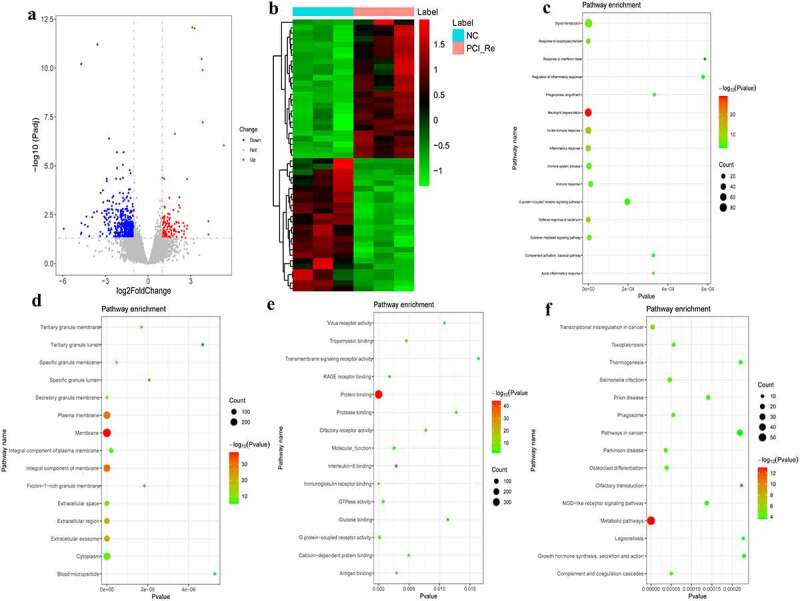
Figure 2.

DEmRNAs analysis of the NC/PCI_Re group.
a: Volcano map of DEmRNAs in the NC/PCI_Re group; b: Heatmap of DEmRNAs in the NC/PCI_Re group; c: Top 15 significantly enriched biological process (BP); d: Top 15 significantly enriched cell composition (CC); e: Top 15 significantly enriched molecular function (MF); f: Top 15 significantly enriched Kyoto Encyclopedia of Genes and Genomes (KEGG) pathways. Heatmap shows result of a two-way hierarchical clustering of DEmRNAs (row) and samples (column). DEmRNAs clustering tree is displayed on the left. Red indicates above the reference channel. Green indicates below the reference channel.
