
Figure 1.
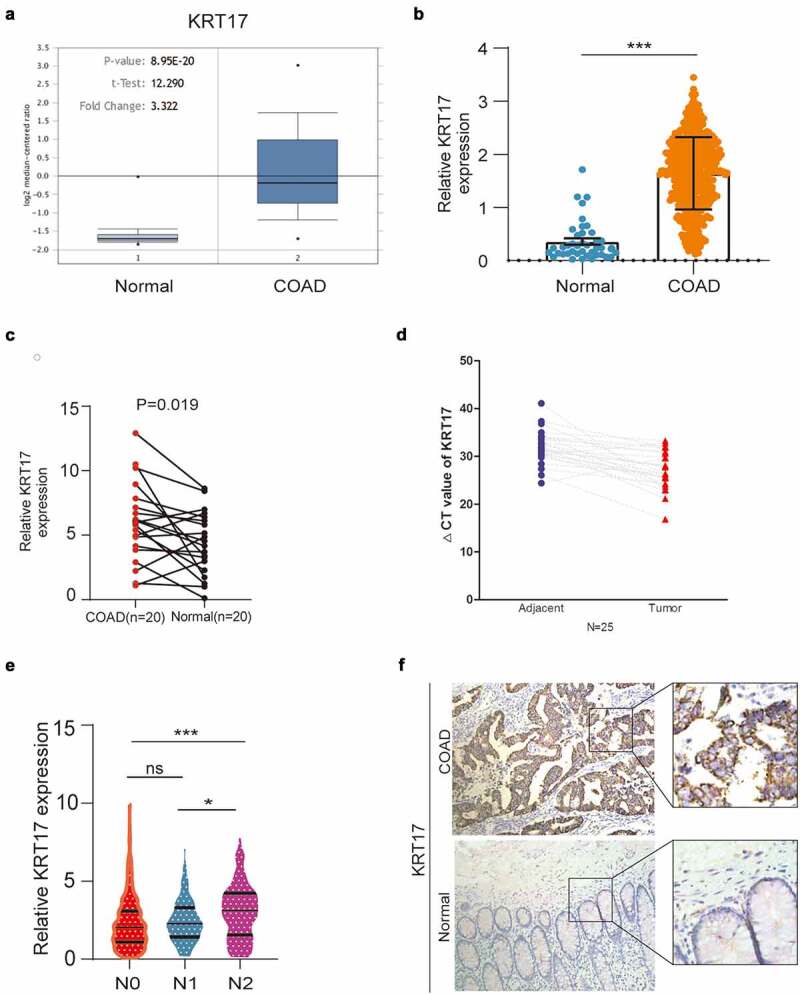
KRT17 upregulation in COAD. (a, b) Data from Oncomine and TCGA databases shows that KRT17 is upregulated in COAD as compared to the normal control tissues. (c) KRT17 expression in 20 paired COAD and matched adjacent normal tissues from TCGA database; P-values are shown (n = 20). (d) RT-PCR analysis of KRT17 expression in 25 COAD tissues; ΔCT value is inversely proportional to relative expression. (e) KRT17 expression is related to the N stage (*P < 0.05 **P < 0.01 ***P < 0.001). (f) Immunohistochemical staining for KRT17 in COAD and normal tissues