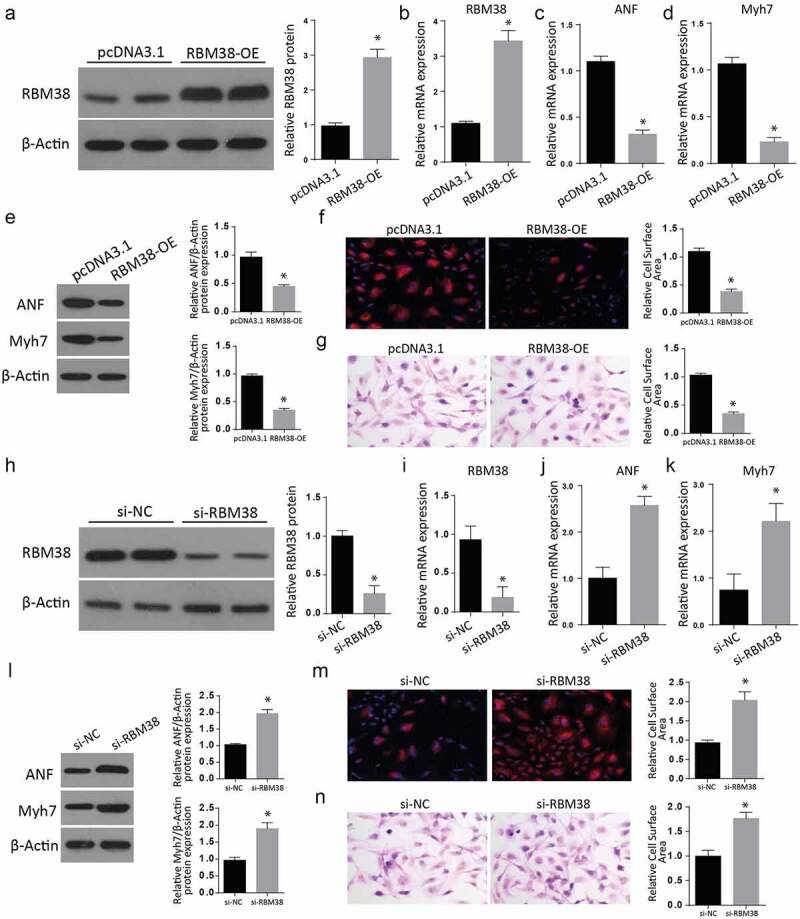
Figure 2.

Modulating RBM38 expression exerts inverse effects on myocardial hypertrophy markers
a: Western blot analysis showing the Relative protein expression of RBM38 in H9C2 cells transfected with RBM38 OE plasmid. b: RT-qPCR analysis showing the relative mRNA expression of RBM38 in H9C2 cells transfected with RBM38 OE plasmid. c-d: Relative mRNA expression of myocardial hypertrophy markers ANF and Myh7 in H9C2 cells transfected with RBM38 OE plasmid by RT-qPCR.e: Western blot analysis showing significantly reduced expression of myocardial hypertrophy markers ANF and Myh7 in H9C2 cells transfected with Rbm38-OE.f-g: Rhodamine-labeled phalloidin staining (f) and H&E staining (g) assays showed a significant reduction of the relative cell surface area in RBM38-OE than in the pcDNA3.1 cells.h- i: The western blot assay results demonstrated a significantly reduced RBM38 expression in the si-RBM38 than in the si-NC group.j: RT-qPCR assays indicate a significantly reduced RBM38 mRNA expression, but significantly increased ANF and Myh7 mRNA expression expressions (Figure 2k) in the si-RBM38 compared to the si-NC groups.l: Western blot assays indicating increased ANF and Myh7 proteins expressions in si-RBM38 cells compared to si-NC group (Figure 2l).m-n: Rhodamine-labeled phalloidin staining (m) and H&E staining (n) assays showing a significant increase of the relative cell surface area in si-RBM38 than in the si-NC cells. (*p < 0.01)
