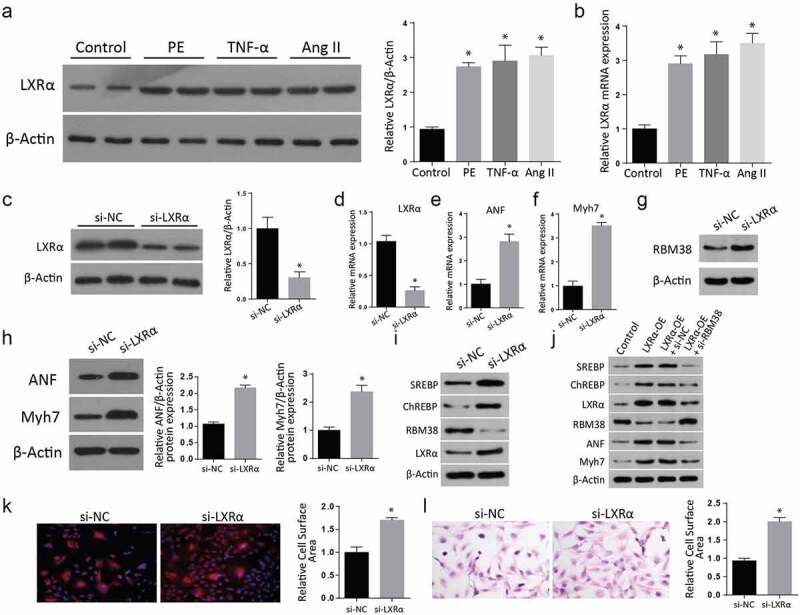
Figure 3.

LXRα expression regulates the myocardial hypertrophy markers in H9C2 cells
a: Western blot results of LXR-α showing a significant increase after the treatments with PE, TNF-α, or Ang II compared to the control group.B: RT-qPCR results of elevated LXR-α mRNA expression in the treated cells compared to the control group.C: Western blot results show a significant reduction of LXR-α protein expression in the si-LXR-α cells compared to the si-NC group.d-f: LXR-α mRNA expression assessment through RT-qPCR demonstrating down-regulated LXR-α mRNA expression (Figure 3d), ANF mRNA expression (Figure 3e), and Myh7 mRNA expression (figure 3f) in in Si-LXR-α cells as compared to the si-NC groups.g: Assessment of myocardial hypertrophy markers ANF and Myh7 protein expression in both the Si-LXR-α and the Si-NC cells through western blot. Both the expression of ANF and Myh7 proteins were increased in the Si-LXR-α as compared to the Si-NC cells.h: Similarly, the expressions of myocardial hypertrophy markers ANF and Myh7 protein expression were significantly increased in the Si-LXR-α as compared to the Si-NC cells (Figure 3h).i: Further western blot analysis of proteins demonstrated a remarkable increment of SREBP, ChREBP, and LXR- α, but a drop in the RBM38 protein level in the si-LXR- α cells compared to the si-NC (Figure 3i).j: Western blot analysis of cells transfected with LXRα-OE, LXR α -OE+ si-NC, LXR α -OE+ si-RBM38. SREBP, ChREBP, LXR- α, RBM38, ANF, and Myh7 levels were significantly elevated in the LXR-α -OE, LXR-α-OE+si-NC and LXRα-OE+ si-RBM38 cells compared to the control group.k-l: Rhodamine-labeled phalloidin staining (K) and H&E staining (L) indicating significant relative cell surface area increase in si-LXR-α as compared to the si-NC. (*p < 0.01)
