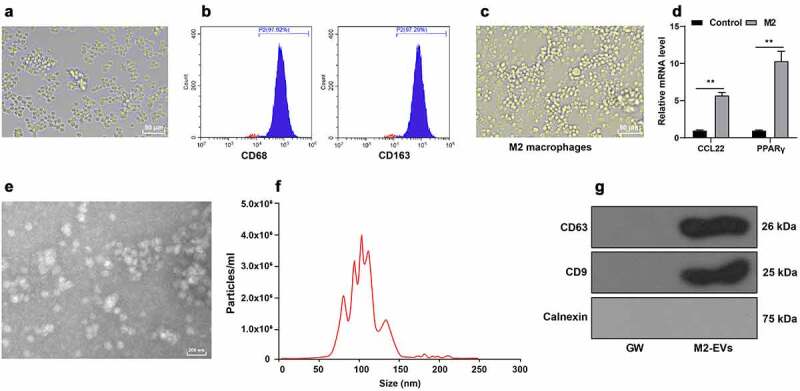
Figure 1.

Identification of M2 macrophages and M2-EVs. Mouse peritoneal macrophages were isolated. a: The morphology of macrophages was observed under microscope. b: The markers of M2 macrophages (CD68 and CD163) were analyzed using flow cytometry after IL-4 induction. c: The morphology of M2 macrophages was observed under the microscope. d: The polarization molecules of M2 macrophages (CCL22 and PPARγ) were determined using RT-qPCR. e: The morphology of M2-EVs was observed under transmission electron microscope. f: The size and concentration of M2-EVs were measured using Nanoparticle tracking analyzer. g: The specific markers of M2-EVs (CD63, CD81, and Calnexin) were determined using Western blot. The experiment was repeated 3 times independently. Data are presented as mean ± standard deviation. Data in panel D were analyzed using two-way ANOVA, followed by Sidak’s multiple comparison test, **p < 0.01
