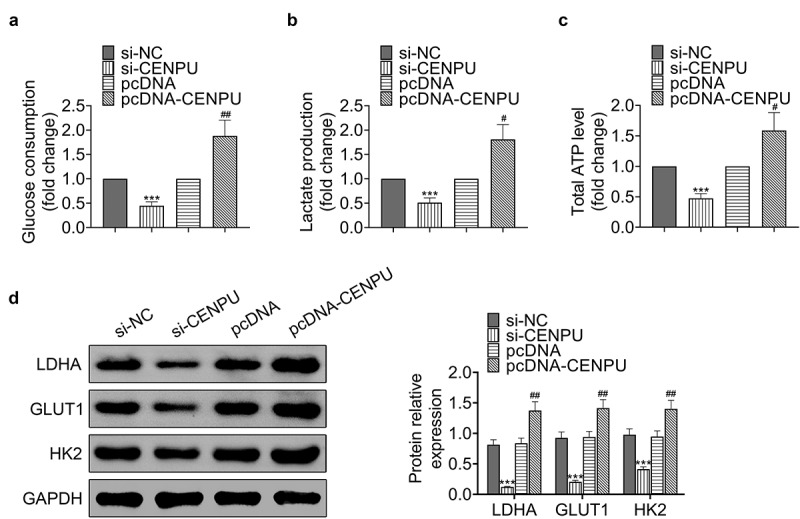
Figure 3.

Knockdown of CENPU inhibited glycolysis of gastric cancer cells. (a) Glucose consumption was detected by glucose assay kit in AGS cells. ***p < 0.001 vs si-NC, ##p < 0.01 vs pcDNA. Data are mean ± SEM of at least three independent experiments. (b) Lactate production was assessed by lactate assay kit in AGS cells. ***p < 0.001 vs si-NC, #p < 0.05 vs pcDNA. Data are mean ± SEM of at least three independent experiments. (c) Total ATP content was measured by ATP assay kit. ***p < 0.001 vs si-NC, #p < 0.05 vs pcDNA. Data are mean ± SEM of at least three independent experiments. (d) Left, representative blots of WB analysis of LDHA, GLUT1 and HK2 protein expression levels after transfections with si-CENPU and pcDNA-CENPU. Right, the relative protein expression levels of LDHA, GLUT1 and HK2 normalized to GAPDH. ***p < 0.001 vs si-NC, ##p < 0.01 vs pcDNA. Data are mean ± SEM of at least three independent experiments
