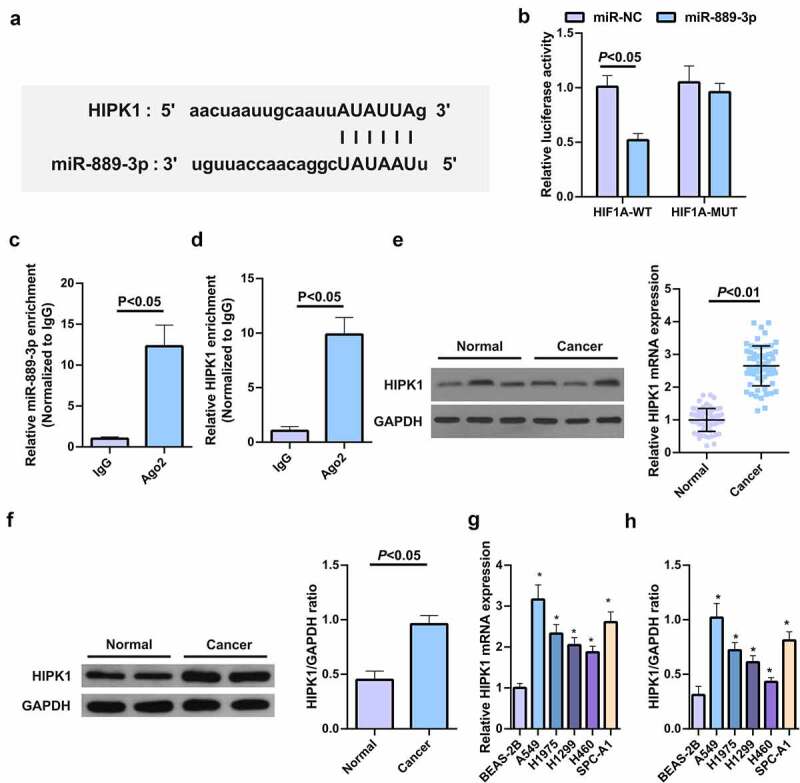
Figure 3.

HIPK1 is sponged via miR-889-3p
A. The binding sites of HIPK1 with miR-889-3p manifested in StarBase software; B. MiR-889-3p enrichment in A549 cells by Ago2 antibody or IgG; C. HIPK1 enrichment in A549 cells by Ago2 antibody or IgG, and the targeting of miR-889-3p with HIPK1 verified via dual luciferase reporting experiment; D. Detection via qPCR for HIPK1 in clinical samples; E. Detection via qPCR for HIPK1 in cell lines; F. HIPK1 in clinical samples detected by Western Blot; G. HIPK1 in cell lines detected by Western Blot. The data in the figures were all measurement data in the form of mean ± SD. * vs the BEAS-2B, P < 0.05.
